What Is LLM Observability and How Span-Based Tracing Captures Every Step of a Prompt Chain
ELI5
LLM observability records every step inside an AI chain — the prompt that went in, the model response that came out, the latency at each hop, and the token cost of each call — so you can diagnose unexpected outputs and trace failure back to the specific step that caused it.
When a Python function throws a TypeError, the runtime hands you a stack trace: file, line, argument, call chain. A prompt chain that returns confident nonsense — a fabricated tool argument, a retrieved chunk that contradicts the final answer, a synthesis step that quietly dropped the most important sentence — hands you exactly one diagnostic artifact: the output itself. Most teams respond to this by adding print statements and calling it observability. The instinct is right in direction but wrong in structure.
What Logging Misses and Spans Capture
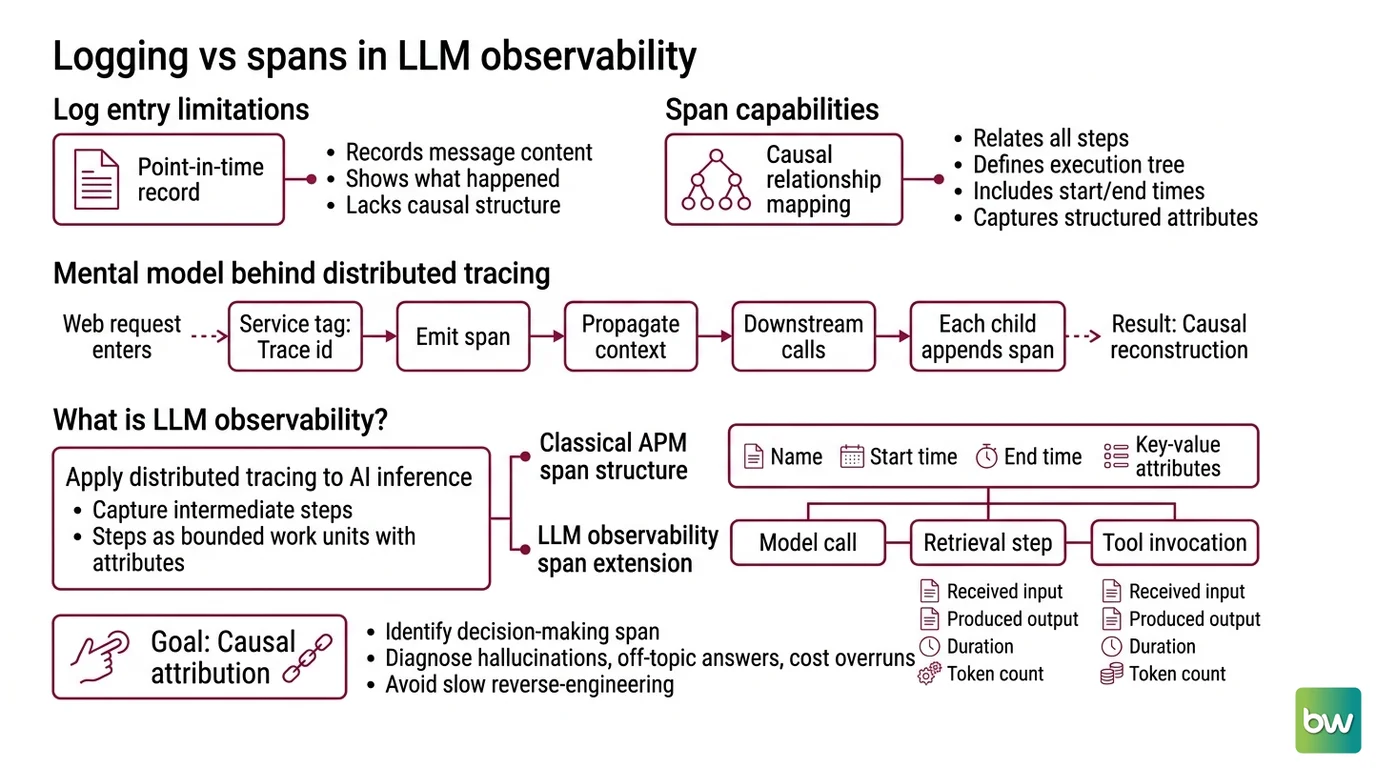
Prompt Logging records the content of what went into a step and what came out. That solves a specific problem — message capture — but it does not give you causal structure. A log entry tells you what happened at one point in the chain. A span tells you how that step relates to every other step in the execution tree: its parent, its children, its start time, its end time, and the structured attributes measured while it ran.
This is the mental model behind Distributed Tracing. When a web request enters a microservice, the service tags it with a trace ID, emits a span for its own work, and propagates the trace context to every downstream call. Every child service appends its own span. At the end you hold a causal tree — a reconstruction of what touched the request, in what order, for how long. Prompt chains are structurally identical to service graphs. The same model applies.
What is LLM observability?
LLM Observability is the practice of applying distributed tracing to AI inference — capturing not just the final output of a chain, but every intermediate step that produced it, with each step modeled as a bounded unit of work carrying structured diagnostic attributes.
In classical APM, a span is a bounded unit of execution: a name, a start time, an end time, and key-value attributes. LLM observability extends this model downward into the AI layer. The model call becomes a span. The retrieval step becomes a span. The tool invocation becomes a span. Each component records what it received, what it produced, how long it took, and how many tokens it consumed.
The goal is causal attribution. When a chain produces an unexpected output — a hallucinated citation, an off-topic answer, a cost overrun — the trace identifies which span made which decision. Without this structure, the diagnostic process is reverse engineering from the final answer backward, which is slow and unreliable at production scale.
This is the category error print statements make: they capture the content of a step, but they do not give that step a parent, a duration, or a position in the execution tree. Log lines accumulate; they do not reconstruct causality.
The Five Span Types and the Trace They Form
Span-based tracing for LLM systems follows the OpenTelemetry GenAI semantic conventions — currently EXPERIMENTAL as of 2026, with the specification maintained in the open-telemetry/semantic-conventions-genai repository (OpenTelemetry GitHub). These conventions define five span types that together model everything a production AI system does (Datadog Blog):
- LLM spans capture a single model call: the model name, prompt content, completion content, temperature and token limit settings, and the token count for input, output, and (where applicable) reasoning.
- Task spans mark named logical units of work within an agent — “retrieve context,” “format output,” “validate response” — wrapping the operations that accomplish a defined sub-goal.
- Workflow spans form the outermost boundary of a chain execution, containing all child spans for one complete end-to-end run.
- Tool spans record individual tool invocations: a database query, a web search, a code execution call. They capture the tool name, the arguments passed, and the result returned.
- Agent spans enclose the reasoning and planning loop of an autonomous agent — the span that contains all the decisions made before the agent delegates to tools or models.
These five types nest. A Workflow span contains Agent spans; Agent spans contain Task and Tool spans; Task spans contain LLM spans. The resulting trace is a tree, and the tree shape makes two things visible simultaneously: the execution sequence (which step ran after which) and the cost distribution (which span consumed the most tokens or wall-clock time).
How does LLM observability work in a production AI system?
Production instrumentation assembles across three levels, each suited to a different part of the chain:
Auto-instrumentation covers the majority of framework interactions. LangChain, LlamaIndex, and direct OpenAI SDK calls emit spans automatically when the observability library is imported alongside the framework. Datadog LLM Monitoring auto-instruments OpenAI, Anthropic, and AWS Bedrock calls without requiring changes at the call site (Datadog Blog). Auto-instrumentation handles the common paths; it does not reach into custom business logic.
Manual instrumentation fills the gaps. For retrieval functions, custom ranking steps, or application-layer cache lookups that sit outside the instrumented frameworks, the developer wraps the operation in an explicit span boundary using the OTel SDK. The result is a span that describes what the business logic unit did, with the same structure as auto-generated spans.
Evaluation hooks attach quality signals to existing spans after the fact. LLM-as-judge scores, human annotation, and dataset-driven regression checks produce quality metadata that lives alongside the latency and cost data already in the trace. The evaluation score and the timing data are queryable together — which is the point where observability becomes useful for quality improvement, not just diagnosis.
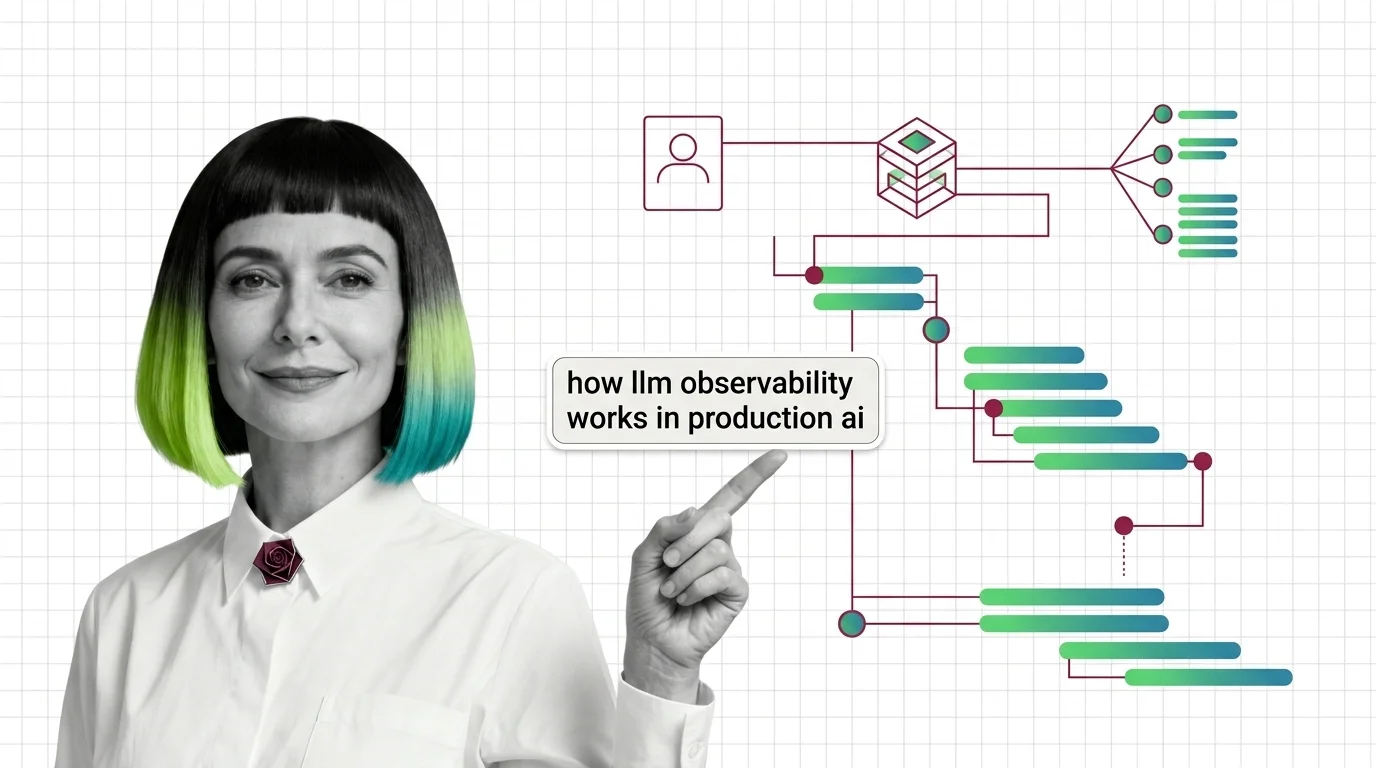
The output is a waterfall view: a timeline where each span appears as a horizontal bar, nested inside its parent, with duration visible as bar length and span attributes accessible on click. When a chain takes longer than expected and you need to find the bottleneck, the waterfall gives you the answer in one query.
What are the main components of an LLM observability stack?
An LLM observability stack assembles into three conceptually distinct layers.
The collection layer is the SDK or agent framework emitting traces. OpenTelemetry is the converging standard; its GenAI semantic conventions define the attribute schema (span names, attribute keys, enumeration values) that downstream platforms expect. One caution applies here: a new attribute, gen_ai.usage.reasoning.output_tokens, was added in 2026. Upgrading the OTel SDK without updating dashboards causes those values to arrive as silent nulls — the metric is present in the traces but goes unmeasured (OpenObserve Blog). Every semconv upgrade should be treated as a planned migration, not a dependency bump.
The storage and analysis layer is the backend that ingests traces, indexes them, and makes them queryable. The active platforms as of mid-2026 (pricing per Confident AI):
| Platform | License | Pricing | Notable |
|---|---|---|---|
| Langfuse | MIT | From $29/month Cloud | Acquired by ClickHouse Jan 2026; v3 backend |
| Arize Phoenix | Elastic License 2.0 | From $50/month (Arize AX) | OTel-native; eval-heavy workflows |
| LangSmith | Proprietary | $39/seat/month | Deep LangGraph integration |
| Braintrust | Proprietary | $249/month Pro | CI-style eval gates |
| MLflow | Apache 2.0 | Free | Built-in tracing; common in ML-heavy orgs |
| Datadog LLM Monitoring | Usage-based | Enterprise | APM extension |
Langfuse was acquired by ClickHouse on January 16, 2026 (Langfuse Blog). The v3 backend migrated from Postgres to ClickHouse for performance at trace volume; the MIT license was explicitly preserved post-acquisition with no planned changes.
The evaluation layer is structured quality assessment attached to existing traces. This is where LLMOps tooling becomes measurable rather than inferential — LLM-as-judge scores, human annotation queues, and regression test suites produce quality signals that occupy the same data model as latency and cost, making quality regressions queryable alongside operational ones.
What the Span Model Predicts
Understanding span structure lets you reason about failure modes before they appear in production, because each span type has a characteristic failure signature.
If total chain cost is higher than expected, the trace isolates which span consumed the budget. The usual cause is a retrieval step returning more context than the model needs — a problem completely invisible if you’re measuring only at the request level. If latency spikes, the waterfall separates model inference time from retrieval time from tool execution time. These three have different root causes and different fixes; treating them as a single “response time” metric makes root cause analysis a guessing exercise.
If a model returns a hallucinated argument for a tool call, the Tool span captures the argument and the error response together — cause and effect in the same record. If a prompt template changes between deployments and quality drops, the LLM span captures the full prompt text from both versions, making the correlation a query rather than an investigation.
The diagnostic signal is rarely in a single trace.
Not in the outlier. In the distribution.
A single slow trace is noise. A thousand traces where the same Task span consistently accounts for the majority of latency is a structural finding — it tells you where optimization effort belongs. This is the same principle that makes flamegraphs useful in classical profiling, applied to token budgets and inference passes.
Rule of thumb: instrument at the span level before measuring at the request level. Aggregate latency tells you that something changed; span distributions tell you where and in which component.
When it breaks: The OTel GenAI semantic conventions are EXPERIMENTAL, and attribute schemas change between releases. An SDK upgrade that touches span attributes should be validated against dashboards before reaching production — not treated as a routine dependency update. The silent null problem with gen_ai.usage.reasoning.output_tokens is not unique; any new attribute added to the spec can silently drop in dashboards that were built against an earlier version.
Tool status notes:
- Helicone: Acquired by Mintlify on March 3, 2026; now in maintenance mode — security patches only, no new integrations or analytics roadmap. Do not adopt Helicone for new projects (Helicone Blog).
- OTel GenAI semconv: EXPERIMENTAL status as of 2026. Attribute names change between releases. Validate dashboards after every semconv upgrade — silent nulls are the failure mode, not errors.
The Data Says
Span-based tracing applies the mental model of distributed systems observability to AI chains, mapping each component — model call, retrieval step, tool invocation, agent loop — to a bounded unit of work with a start time, end time, parent reference, and structured diagnostic attributes. The OpenTelemetry GenAI semantic conventions define five span types for this purpose, currently in EXPERIMENTAL status. The operational implication is precise: without span-level causal structure, diagnosing failures in a multi-step prompt chain collapses into pattern-matching against the final output. The output is the least informative diagnostic point.
AI-assisted content, human-reviewed. Images AI-generated. Editorial Standards · Our Editors