What Is LLM Logging and Auditing and How Production Systems Capture Prompts, Costs, and Traces
ELI5
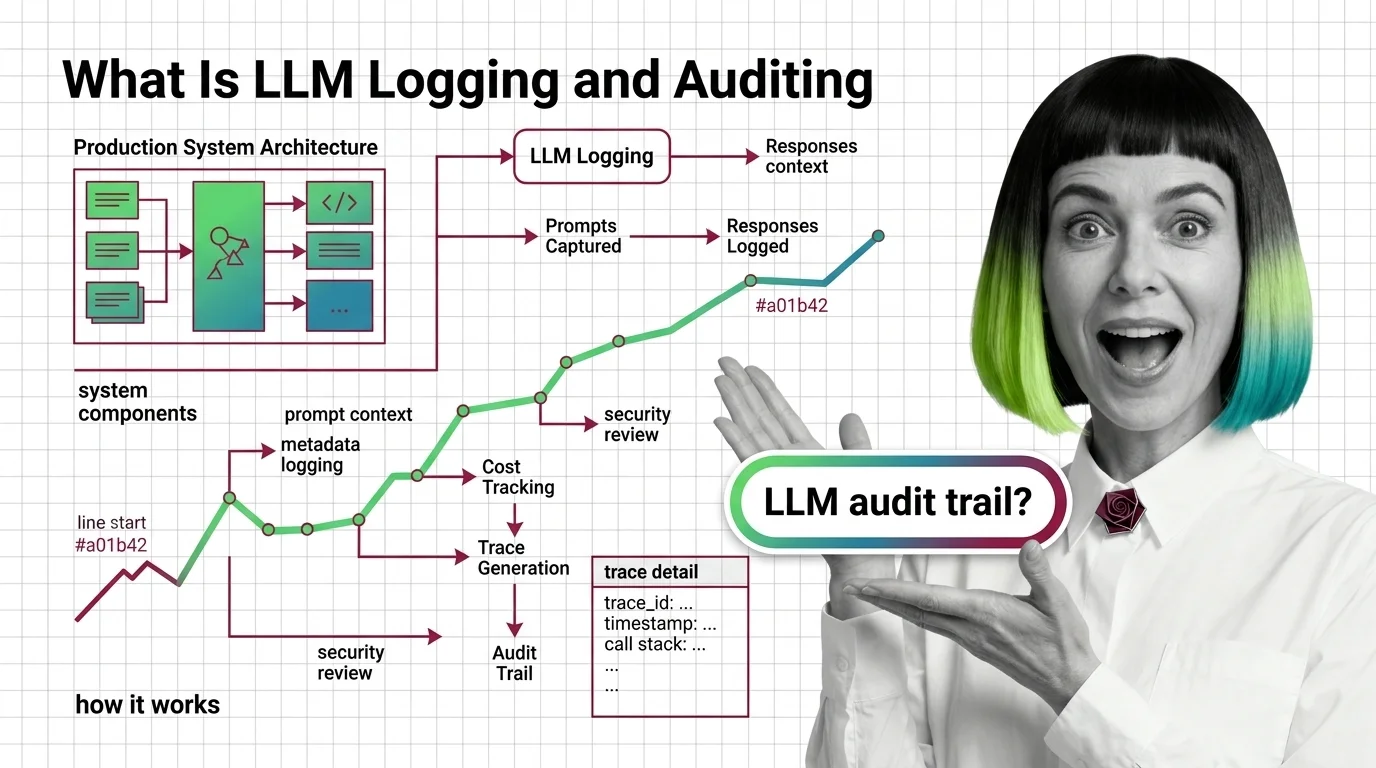
LLM logging and auditing records every inference call — the prompt sent, the response returned, the tokens consumed, and the latency incurred — into a structured, queryable trail that lets you reconstruct what your production system did and why it cost what it did.
The invoice arrives, and the number is wrong. Not wrong in a way that maps cleanly to a bug — no exception was thrown, no alert fired. The model called, it responded, the user got an answer. But somewhere in the sequence of sessions, rerouted requests, and partially cached completions, the token count grew quietly past what the estimates predicted. Without an audit trail, the post-mortem is guesswork.
This is the problem that LLM Logging And Auditing was designed to solve — not just for cost anomalies, but for any question that starts with “what did the system actually do?”
The Signal Hidden Inside Every Inference Call
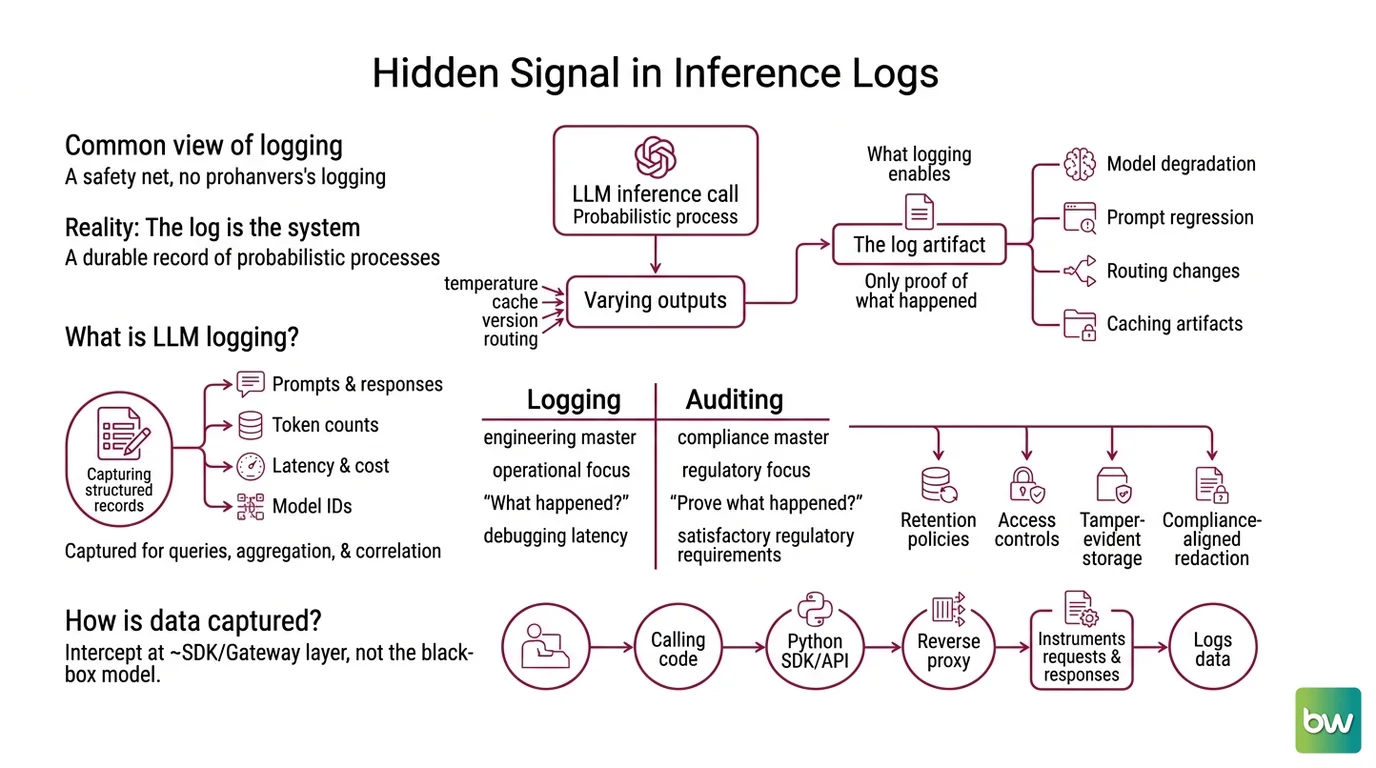
Most developers think of logging as a safety net: something you enable when things go wrong. That mental model inverts the causality. In production LLM systems, the log is the system — the only durable record of a probabilistic process that produces different outputs from the same input depending on temperature, cached state, model version, and routing decision.
An LLM inference call is not a deterministic function. The log is the only artifact that proves what actually happened. Without it, you cannot distinguish a model degradation from a prompt regression from a routing change from a caching artifact.
What is LLM logging and auditing?
LLM logging is the practice of capturing structured records from inference calls — prompts, responses, token counts, latency, model identifiers, and cost estimates — in a form that can be queried, aggregated, and correlated across time. Auditing is the downstream layer: applying retention policies, access controls, tamper-evident storage, and compliance-aligned redaction to those records so they satisfy regulatory and compliance requirements as well as operational ones.
The distinction between logging and auditing matters because they serve different masters. Logging is primarily operational: it answers “what happened?” for engineering teams debugging latency spikes or cost overruns. Auditing is primarily regulatory: it answers “can you prove what happened?” for compliance officers, security reviewers, and incident investigators. Production systems need both, and they fail differently when each is absent.
How does LLM logging capture prompts and responses in a production system?
The mechanism relies on interception at the SDK or gateway layer — not at the model itself, which is a black box from the caller’s perspective. The calling code, whether a Python SDK wrapping an API or a reverse proxy sitting in front of multiple providers, instruments each request and response before and after the HTTP roundtrip.
Structured Logging is the foundational layer: rather than appending free-text lines to a log file, each inference event is serialized as a structured record with typed fields — model name, timestamp, prompt hash, input token count, output token count, latency in milliseconds, and a trace identifier that links this generation to the broader request context. The trace identifier is what makes logs navigable; without it, a session with ten inference calls produces ten disconnected records that cannot be assembled into a coherent sequence.
Content capture — the actual text of prompts and completions — is a deliberate choice, not a default. The
OpenTelemetry GenAI semantic conventions (in Development/Experimental status as of May 2026) make this explicit: content capture requires setting OTEL_INSTRUMENTATION_GENAI_CAPTURE_MESSAGE_CONTENT=true (Greptime Blog). This is not an oversight in the spec design. Prompt text is often sensitive; capturing it by default would create a compliance liability for every team that deployed the instrumentation. Teams that need full prompt replay for debugging opt in explicitly; teams operating under strict data handling policies leave it off and work with hashes instead.
What the OpenTelemetry GenAI Spec Actually Captures
The OpenTelemetry GenAI semantic conventions are the nearest thing to a shared vocabulary for LLM observability. They define a common set of span attributes, metric names, and event types that any instrumentation library can emit — making traces from different providers, frameworks, and runtimes interoperable without custom translation layers.
Understanding what the spec specifies reveals what a well-instrumented system can know — and what it deliberately omits. The omissions are not oversights; they reflect deliberate tradeoffs between operational completeness and compliance safety.
What are the core components of a production LLM audit trail?
A production audit trail assembles four categories of evidence: identity, consumption, timing, and content.
Identity is carried by span attributes that answer “which model did this?”: gen_ai.request.model records what was requested, and gen_ai.response.model records what actually served the request (OpenTelemetry Blog). These are distinct fields because
Model Routing and fallback logic can silently substitute one model for another — a routing change from a more capable to a less capable model leaves no trace in the response text, only in this attribute pair.
Consumption is carried by gen_ai.usage.input_tokens and gen_ai.usage.output_tokens, the fields that feed cost calculations (OpenTelemetry Blog).
LLM Cost Management systems multiply these counts against per-token pricing to produce a USD estimate per generation. The nuance is that cached tokens price differently — Langfuse, for instance, tracks cached_tokens and audio_tokens as separate cost fields alongside the standard input/output split, and evaluates conditional pricing tiers such as Anthropic’s surcharge above 200K input tokens (Langfuse Docs).
Timing is carried by gen_ai.client.operation.duration, a latency histogram that measures the full roundtrip from client request to response delivery. Time to first token — the interval before streaming begins — is a separate concern not directly modeled in the current attribute set but captured in some tooling as a derived metric.
Content, when enabled, flows through the event named gen_ai.client.inference.operation.details, which captures full prompts and completions as structured events on the span (Greptime Blog). The evaluation layer adds gen_ai.evaluation.result with score.value and score.label — a slot for attaching LLM-judge or human annotation scores directly to the trace.
For agent workflows, the spec extends the span type vocabulary to invoke_agent, execute_tool, and invoke_workflow (Greptime Blog). A multi-step agent run that calls three tools and two sub-models generates a span tree rather than a single span — the same
Distributed Tracing pattern that distributed systems engineers already understand, now applied to chains of inference calls.
The Hierarchy That Makes Traces Navigable
A single span answers “what happened in this call?” A trace answers “what happened in this session?” The gap between them is where most ad-hoc logging implementations break down.
Langfuse models this hierarchy explicitly: Traces contain Observations, where Observations are typed as generations (LLM calls), spans (arbitrary operations), tool calls, or events (Langfuse Docs). A user session becomes a Trace; each model call within it becomes a generation Observation; a retrieval step becomes a span Observation. The tree structure means you can ask “what did this session cost?” by summing generation costs across the trace, or “which step introduced the latency?” by comparing span durations.
This hierarchy is what separates LLM Observability from simple request logging. Request logging answers operational questions about individual calls. Observability answers structural questions about system behavior — why latency spiked on Tuesdays, which Prompt Logging pattern predicts high cost, whether a particular model version introduced more refusals than its predecessor.
The Token Budget management use case illustrates the difference. A logging system can tell you that a specific call consumed 47,000 input tokens. An observability system can tell you that the prompt template responsible for 70% of high-token calls is the one used in the document summarization workflow, and that it consistently runs long for PDF inputs above a certain length. The first fact is a data point; the second is an actionable finding.
The Audit Layer: Where Logging Becomes Evidence
Operational logs and audit records are not the same artifact, even when they derive from the same events. The distinction matters under regulatory scrutiny.
Audit records answer “can you prove what happened?” rather than “what happened?” That shift in framing changes what the record must contain. NIST AI RMF requirements specify that audit records capture model version, policy version applied, redaction action taken, and timestamp — but they do not require the prompt text itself (AppScale Blog). An audit record stores decision metadata and a SHA-256 hash of the inspected payload, not the prompt content (Medium, Neurobyte). The hash provides tamper-evidence without exposing the data: you can verify that a particular payload was reviewed without reconstructing what it said.
This design pattern also addresses the PII problem. The PII Redaction architecture that satisfies compliance requirements runs redaction before serialization — at the SDK or gateway layer — not as a post-processing step against stored logs. Once a prompt containing a Social Security Number or medical record identifier reaches a log store, the log store becomes a regulated data asset. Running a three-layer redaction pipeline (regex and checksum, then NER using DeBERTa, then LLM-judge for edge cases) at the gateway layer keeps the log store clean from the start (AppScale Blog). The policy is an allowlist, not a blocklist — a meaningful distinction because novel PII patterns slip past blocklists, while an allowlist requires explicit authorization for any personal data to pass through.
The timing constraint is precise: PII redaction must happen before serialization, not post-hoc against persisted logs (TrueFoundry Blog). Persisting first and redacting later creates a window during which sensitive data exists in the log store — a window that may be sufficient to trigger breach notification obligations depending on jurisdiction.
What This Architecture Predicts
Understanding the mechanism suggests a set of if/then relationships that turn passive knowledge into active system design.
If a
Model Registry change swaps the serving model without updating the request configuration, gen_ai.request.model and gen_ai.response.model will diverge — the discrepancy is an instrumentation-visible signal that routing or fallback logic fired unexpectedly.
If cost anomalies appear but token counts look normal, the issue is likely in the pricing tier calculation: check whether cached_tokens are being correctly classified, or whether a model version change moved the request into a higher pricing tier.
If a compliance audit requires evidence of PII handling policy enforcement, an audit trail storing SHA-256 hashes of inspected payloads satisfies the “can you prove what happened?” requirement without requiring the system to retain prompt text — the hash proves the payload was processed, the timestamp proves when, and the redaction action field proves which policy applied.
Rule of thumb: design the log for the question you will need to answer under pressure, not for the questions you can anticipate in a calm moment.
When it breaks: the entire audit architecture depends on the instrumentation sitting correctly in the call path. A direct HTTP call to an API endpoint that bypasses the SDK layer — common in cost-optimization experiments or fallback implementations — produces no spans and leaves a gap in the audit trail that no downstream system can fill.
The Tool Picture in 2026
The A/B Testing for LLMs and evaluation workflows that depend on trace data have created a small ecosystem of platforms that all converge on the same underlying data model.
Langfuse is open-source, OTel-native, and self-hostable; it supports over 100 library integrations and handles tiered pricing calculations including provider-specific surcharges (Langfuse Docs). LangSmith is LangChain’s proprietary platform with a free tier of 5,000 traces per month and a Plus tier at $39 per seat; extended retention (400 days) is available at $5.00 per 1,000 traces (LangChain Pricing). OpenLIT offers OTel-native automatic instrumentation with zero-code Kubernetes deployment via eBPF and is free for self-hosted deployments on ClickHouse (Confident AI).
Two freshness caveats apply here:
Tool status notes (as of June 2026):
- Helicone: Acquired by Mintlify in March 2026 and transitioned to maintenance mode. Do not adopt for new projects (ChatForest Review).
- Braintrust: API key and service token creation removed from the REST API (
POST /v1/api_key,POST /v1/service_token); creation is now UI-only, with service tokens re-enabled for org owners as of June 2026 (Braintrust Changelog). Existing integrations that programmatically rotate keys require migration.- OTel GenAI semantic conventions: Still in Development/Experimental status as of May 2026; attribute names are under active change. Use
OTEL_SEMCONV_STABILITY_OPT_IN=gen_ai_latest_experimentalto opt into the latest format during transition (oneuptime.com Blog).
The OTel semantic conventions are becoming the shared substrate. Datadog, Google Cloud, AWS, Azure, and Grafana have all announced alignment. Traceloop’s OpenLLMetry conventions — previously a competing vocabulary — have been merged into the official OTel spec (Dynatrace Community). Whether that convergence completes before the spec reaches stable status is an open question; the Development label means attribute names can still change.
The Data Says
LLM logging and auditing is not a monitoring add-on — it is the only mechanism that makes a probabilistic, stateful, multi-model production system legible after the fact. The OTel GenAI conventions (experimental, May 2026) provide the emerging shared vocabulary; the four evidence categories — identity, consumption, timing, content — define what a complete trace must capture; and the separation between operational logs and tamper-evident audit records reflects the difference between debugging and compliance. The gap that most teams discover under pressure is not missing data — it is the absence of a trace hierarchy that connects individual spans into a navigable session record.
AI-assisted content, human-reviewed. Images AI-generated. Editorial Standards · Our Editors