What Is LLM Load Testing and How TTFT, Tokens-Per-Second, and p99 Latency Are Measured
ELI5
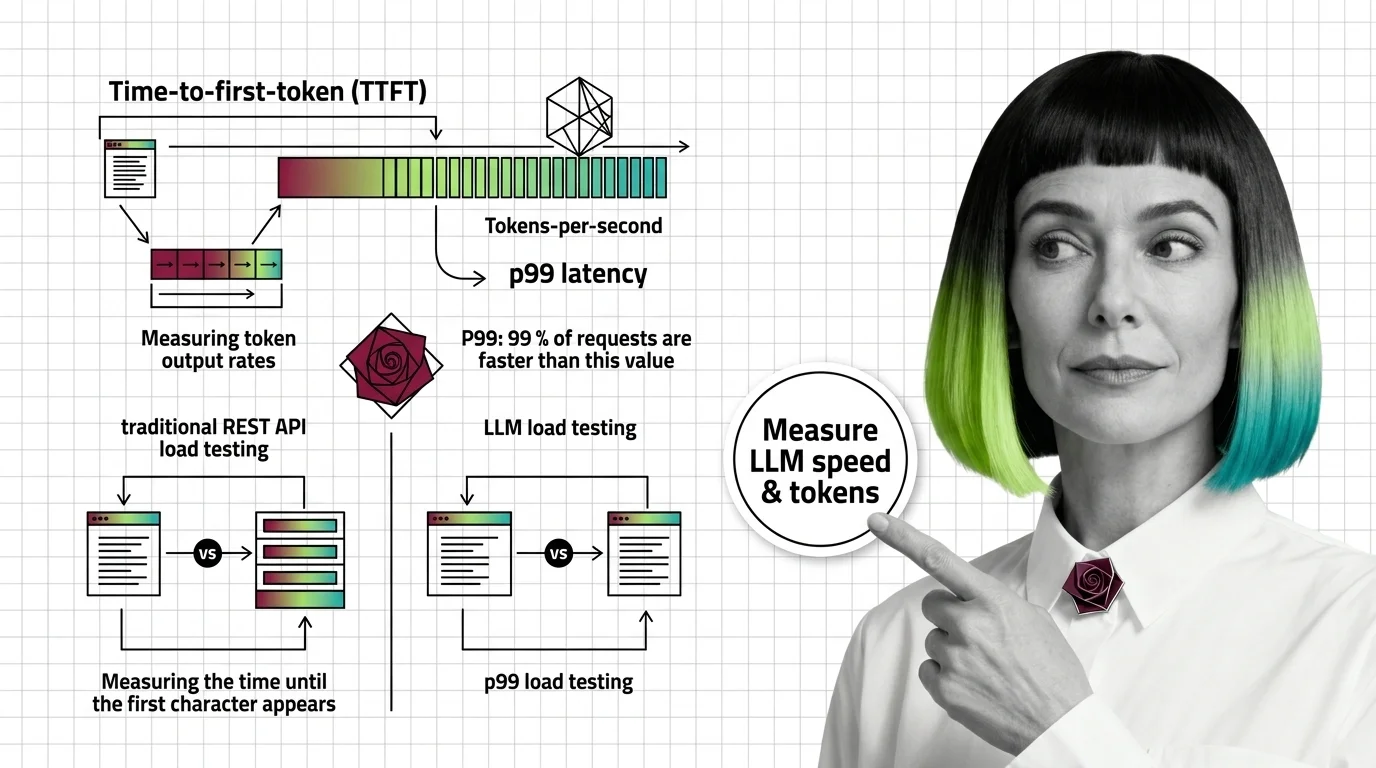
LLM load testing sends concurrent requests to a language model and measures TTFT, tokens-per-second, and p99 latency under real load. The bottleneck is KV-cache GPU memory, not CPU threads—which is why REST API testing methodology gives the wrong numbers.
A single request to a large model responds in under a second. Sixty-four concurrent requests tell a different story. At that concurrency level, P99 TTFT can climb to five times the median response on identical hardware—not because the network degraded or the CPU saturated, but because something internal to inference engines operates by rules that classical backend architecture never anticipated. The question worth understanding is what that something is, and why the tools built for REST APIs were never designed to find it.
The Concurrency Constraint That REST Testing Misses
Load testing a REST endpoint and load testing an LLM inference endpoint look identical from the outside: ramp concurrent users, measure latency distributions, find where the system breaks. But the resource that breaks first is completely different, and that difference changes which metrics matter, which tools are appropriate, and which failure modes are invisible until production.
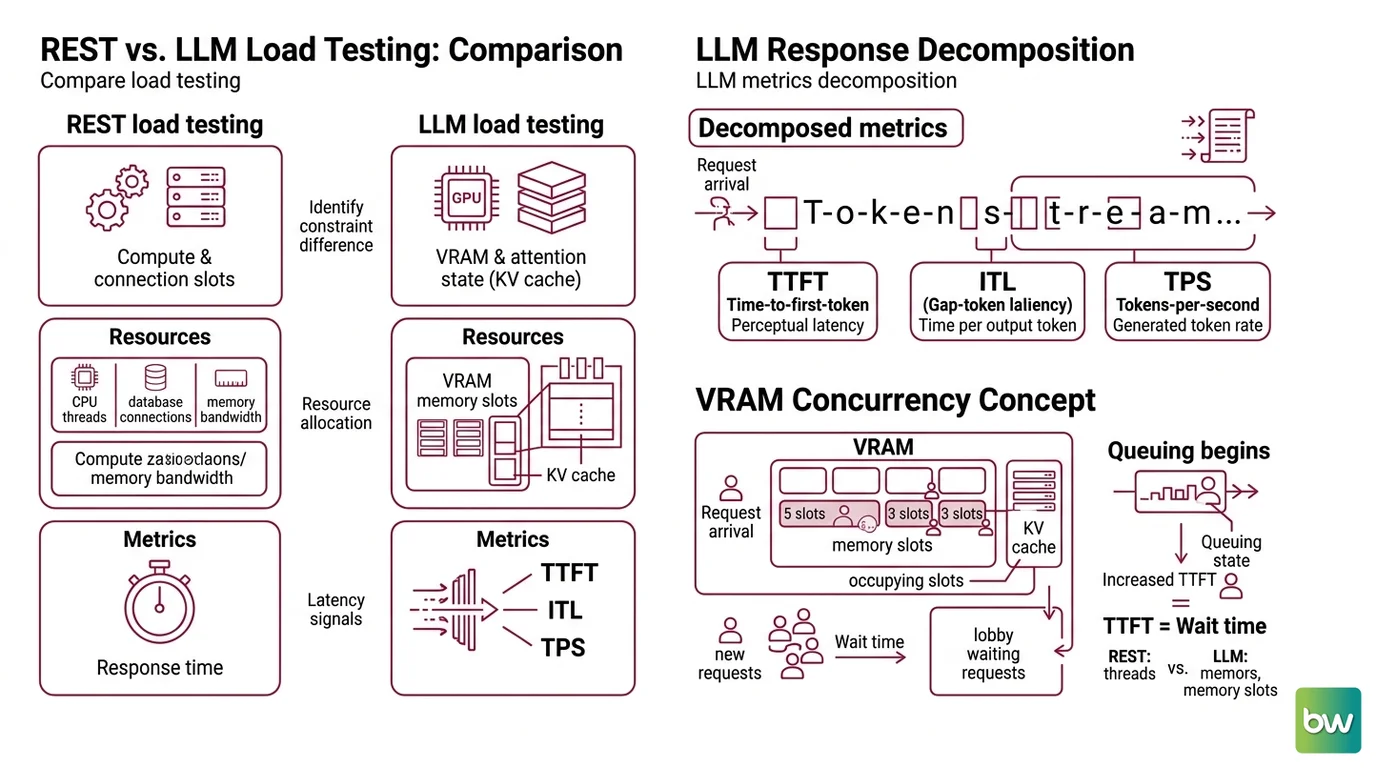
In a typical REST service, concurrency competes for CPU threads, database connection pool slots, and memory bandwidth. The LLM Load Testing environment has a different budget: every in-flight request consumes a block of GPU VRAM to hold the attention state for its token sequence—the KV Cache.
Think of the inference server’s VRAM as a hotel with a fixed number of rooms. Each in-flight request occupies as many rooms as its sequence length requires. When every room is booked, new arrivals wait in the lobby. When queuing begins, Time To First Token stops measuring compute time and starts measuring lobby wait time.
Not threads. Memory slots.
What is LLM load testing?
LLM load testing is the practice of sending concurrent, realistic requests to a language model inference endpoint and measuring how its output characteristics—latency, throughput, error rate—change as load increases. Where REST load testing produces a single response-time number, LLM load testing decomposes the streaming response into at least three distinct signals: TTFT, Inter Token Latency (ITL, also called TPOT—time per output token), and Tokens Per Second.
The decomposition follows from how LLMs respond: as a token stream over Server-Sent Events, not as a complete payload. A user begins reading before the model finishes generating. TTFT determines how quickly that reading can start—it is the perceptual latency, the number that governs whether the interface feels alive or frozen. ITL governs the fluency of the stream once it starts. System tokens-per-second tells you how much the server can generate across all users simultaneously—a throughput measure that looks very different from the per-user experience.
Realistic load testing also requires variable request sizes. An LLM endpoint receives prompts ranging from 50 tokens to 32,000, and the KV-cache footprint of each request varies accordingly. A test suite that sends uniform 100-token prompts underestimates production memory pressure by an order of magnitude; the queue dynamics that emerge with 2,048-token prompts are categorically different from those at 128 tokens, even at identical concurrency levels.
How does LLM load testing differ from traditional REST API load testing?
Three mechanisms separate LLM load testing from classical HTTP load testing—and all three trace to the same root: inference engines are Request Concurrency systems constrained by GPU VRAM, not CPU thread pools.
Memory, not compute, is the bottleneck. A REST service absorbs more concurrent requests by scaling CPU cores or adding replicas. An inference server’s throughput ceiling is set by how many KV-cache slots fit in GPU VRAM. Systems like vLLM implement Continuous Batching and Paged Attention to make that memory allocation more efficient—reducing fragmentation and enabling more concurrent sequences than naïve static batching allows—but the physical VRAM constraint remains. Under high concurrency, requests queue not for CPU access but for a cache slot to become available.
The second difference: the response is a stream, not a payload. Standard tools measure time-to-response—the interval from request dispatch to full response receipt. For a streaming LLM endpoint, that number is nearly meaningless as a user experience signal. A 200-token response might start arriving in 80ms and finish in 3 seconds; a 1,000-token response starts at 80ms and finishes in 15 seconds. Both have the same TTFT. Both have the same per-token ITL. Only their total duration differs—and total duration is the wrong thing to optimize for an interface that streams. The signals that actually matter are invisible to tools that aggregate a streaming response into a single latency sample.
Third: token budgets replace byte budgets. REST load test design expresses request size in kilobytes. LLM load test design requires thinking in tokens—inference cost, KV-cache footprint, and generation time all scale with token count, not byte count. A 1,024-token prompt and a 128-token prompt may differ by fewer than 4KB in raw bytes but differ by 8× in memory footprint and generation time. A load test profile built from byte-normalized request sizes will produce a KV-cache utilization pattern that looks nothing like production.
The combined effect: a k6 script that correctly load-tests a payment API will give systematically optimistic numbers on an LLM endpoint, because it measures the wrong resource, aggregates the wrong signals, and assumes the wrong budget unit.
Measuring the Three Signals: TTFT, ITL, and p99
The formulas behind LLM latency metrics are not arbitrary definitions. Each one isolates a specific source of delay, and understanding the decomposition reveals which system behavior is responsible when numbers go wrong.
How are tokens-per-second and time-to-first-token measured under concurrent load?
TTFT decomposes into three additive terms: network ingress time (how long the prompt takes to arrive at the inference server), queue time (how long the request waits for a KV-cache slot), and prefill time (how long the GPU takes to compute attention over the input tokens before generating the first output). At low concurrency, queue time is near zero—TTFT reduces to ingress plus prefill, both of which scale predictably with prompt length. As concurrent users increase, queue time grows and can come to dominate the total, turning TTFT into a queue depth indicator more than a compute indicator.
Per the NVIDIA NIM benchmarking documentation, ITL is computed as:
ITL = (end_to_end_latency − TTFT) / (total_output_tokens − 1)
This formula excludes the first output token—already accounted for in TTFT—and distributes the remaining generation time across subsequent tokens. In practice, ITL is not constant within a single generation run; it fluctuates as the batch composition changes mid-run and as KV-cache evictions occur. The formula yields the average ITL per request, which is sufficient for SLO evaluation even when instantaneous variation is higher.
System tokens-per-second is the total output tokens across all concurrent users divided by the span from the first request’s dispatch to the last response’s completion (NVIDIA NIM Benchmarking Docs). Per-user tokens-per-second is output sequence length divided by that user’s individual end-to-end latency. System TPS rises while per-user TPS falls—the server generates more tokens in aggregate even as each individual user waits longer for their portion. The two numbers diverge under load, and conflating them produces an optimistic picture of user experience.
P99 Latency is the 99th percentile latency across all requests in a test run. For LLM load testing, P99 TTFT is the critical SLO metric—it captures the worst-case experiences that a consistent 1% of users encounter: requests landing in a full queue, triggering a KV-cache eviction, or batched with unusually long sequences. At low concurrency, P99 and P50 TTFT are close to each other. Under load, they diverge sharply, because tail latency is driven by discrete queuing events that become more frequent as the cache approaches saturation.
A specific measurement illustrates the pattern: at 64 concurrent users on a 70B FP8 model running on an H100 SXM5 GPU, P99 TTFT reached 480ms while P50 TTFT held at 95ms—a 5.1× ratio (Spheron Blog). These values reflect a particular model size and hardware configuration; the ratio, not the absolute numbers, is the observation that transfers. As concurrency increases toward the cache capacity limit, P99 expands disproportionately—the tail stretches faster than the median moves, because the tail is a queue, not a calculation.
Goodput—a metric used in AIPerf and recent academic literature—refines system throughput by counting only requests that met both TTFT and ITL SLO targets. Goodput is more operationally meaningful than raw TPS because it distinguishes “the system produced tokens” from “the system produced tokens quickly enough to be useful.” A deployment that generates tokens at high TPS while missing TTFT SLOs for 30% of requests has lower goodput than a deployment running at lower raw TPS with consistent SLO adherence.
What the Metrics Predict About Production Behavior
Knowing the formulas enables forward reasoning. Each metric is a diagnostic window into a different failure mode, and each failure mode points toward a different remediation.
A high P99 TTFT relative to P50 TTFT—a large tail/median ratio—indicates that the system is entering queue-dominated territory at the tested concurrency level. The first question is whether that concurrency level represents actual production load or an artificial ceiling. If it represents actual load, the remediation is either Model Routing to distribute requests across additional replicas, or increasing the KV-cache allocation (which typically means hardware changes or reducing the maximum sequence length). Setting aggressive timeout retries via LLM Fallback And Retry Patterns without addressing the underlying capacity constraint compounds the problem: each retry adds another request to the same full queue.
A high P99 ITL relative to P50 ITL suggests that some requests are experiencing KV-cache evictions mid-generation. The inference engine is swapping KV blocks to CPU memory to make room for new requests, which introduces latency spikes mid-stream. This failure mode typically emerges at high sequence-length variance: one very long request in a batch can evict the KV blocks of shorter concurrent requests to accommodate its growing attention state.
For SLO-driven capacity planning, the thresholds depend on the application type. Interactive chat requires TTFT P99 ≤ 300ms and ITL P99 ≤ 50ms; voice agents need tighter constraints at TTFT P99 ≤ 150ms and ITL P99 ≤ 30ms; inline code completion requires TTFT P99 ≤ 100ms and ITL P99 ≤ 25ms (Spheron Blog). A LLM Gateway that applies Rate Limiting per application tier can enforce these SLOs by capping concurrent requests before the queue forms—though calibrating the cap requires load testing first to establish the relationship between concurrency and P99 TTFT on the specific hardware and model in use.
Testing through an API Gateway that enforces Virtual Keys per application adds another variable: gateway-level rate limiting artificially caps observed throughput, making the underlying model appear slower than its actual capacity. A Fallback Strategy that routes to a secondary model under load introduces the same ambiguity—the numbers collected during load testing reflect the routing layer’s behavior as much as the primary model’s capacity. Both are worth knowing, but they answer different questions.
Rule of thumb: Run load tests at three concurrency levels—10%, 50%, and 100% of expected peak—and record the P50/P99 TTFT ratio at each. A ratio above 3× at 50% of expected peak is an early warning that the system will miss SLOs at production load.
Not every LLM-serving failure mode surfaces in controlled load testing, however.
When it breaks: Load testing measures steady-state behavior under controlled concurrency ramps; it does not reproduce bursty production traffic, model cold-start latency after idle periods, or multi-turn conversation accumulation—where each additional turn extends the effective KV-cache footprint per user session and changes the memory pressure profile significantly.
Tooling as of Mid-2026
The active tool for structured LLM benchmarking is AIPerf (ai-dynamo/aiperf), at v0.10.0 as of June 9, 2026 (AIPerf GitHub). AIPerf replaces GenAI-Perf as NVIDIA’s recommended benchmarking tool; it measures TTFT, ITL, TPS, RPS, and goodput at p50/p90/p99 and is OpenAI-API compatible. For general HTTP and SSE load generation where LLM-specific metrics require custom instrumentation, Locust (MIT license) with the TrueFoundry LLM Locust extension adds native TTFT and TPS tracking without requiring a NVIDIA-specific serving stack. Inference-server-native benchmarks—vLLM’s built-in benchmark scripts, SGLang’s equivalent—run within a single asyncio process, which limits their accuracy at high concurrency due to the overhead of the measurement tooling itself sharing resources with the server.
Tool status notes:
- GenAI-Perf (NVIDIA/Triton): Deprecated — NVIDIA is no longer actively developing new features. Existing users should migrate to AIPerf (NVIDIA GenAI-Perf Docs).
- LLMPerf (ray-project): Archived December 17, 2025 — read-only, no maintenance (LLMPerf GitHub). Do not use in new projects.
The Data Says
The metric worth tracking is not average latency. The P99/P50 ratio is the queue pressure gauge—a system whose P99 TTFT stays within roughly 2× of P50 at peak load is absorbing pressure efficiently, its cache sized for the load. A ratio climbing past 5× means the KV-cache is the binding constraint and no amount of retry logic or timeout tuning will fix it without capacity changes or load redistribution.
AI-assisted content, human-reviewed. Images AI-generated. Editorial Standards · Our Editors