What Is Data Drift and How Production Data Silently Degrades Model Accuracy
ELI5
Data drift is when the live data flowing into a deployed model stops looking like the data it trained on. The model’s code never changes, but its accuracy quietly erodes because the world it learned has moved on.
A fraud-detection model goes live in spring, sharp and accurate. By winter, it is missing fraud it would have caught on day one. Nobody changed the code. There was no bad deploy, no corrupted table, no retraining gone wrong. The model is computing exactly what it always computed, and that is precisely the problem.
The Model Froze. The World Kept Moving.
Start with the symptom, because the symptom is what fools people. A model that degrades looks broken, so the first instinct is to go hunting for a bug in the code. The bug is not there. The weights are exactly where training left them; what shifted was the data arriving at the door.
What is data drift in machine learning?
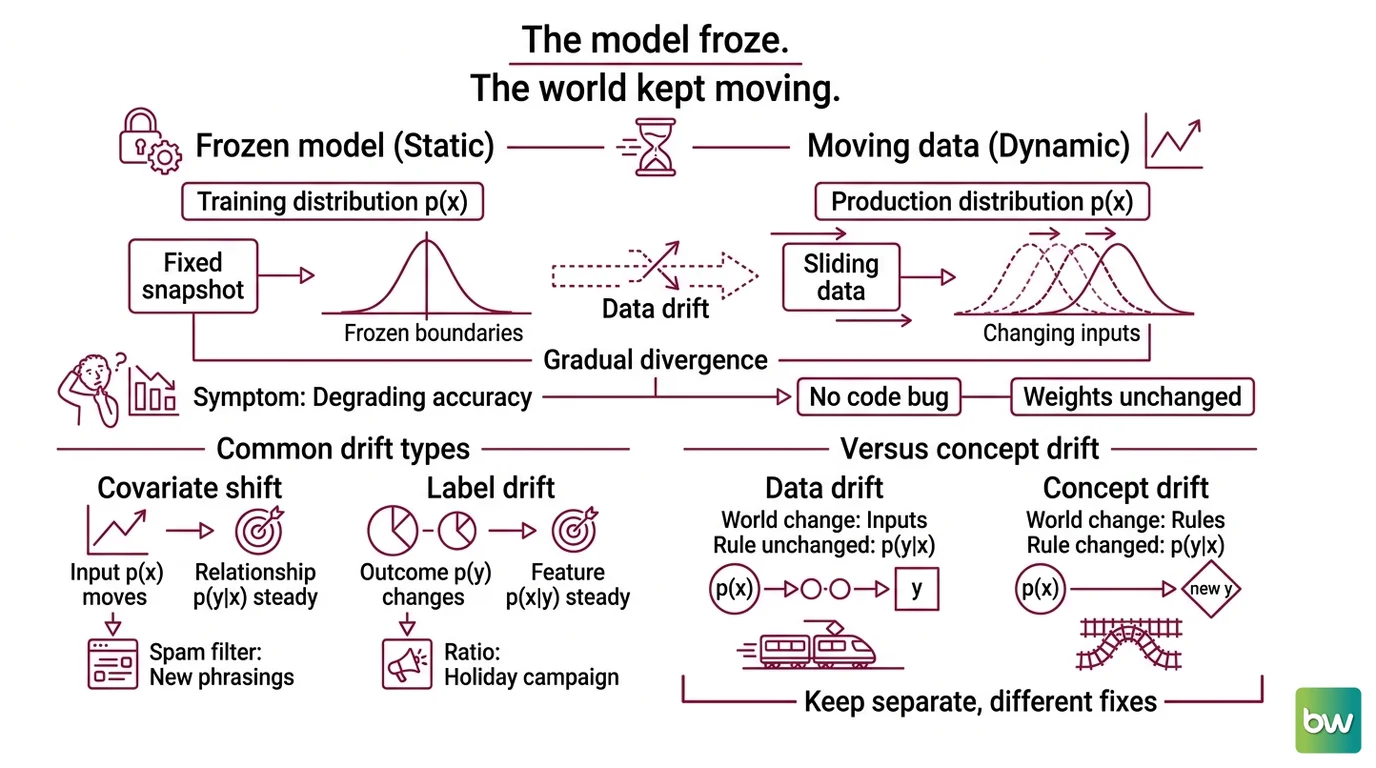
Data drift is the gradual divergence between the distribution a model was trained on and the distribution it now sees in production. A model learns a function from a snapshot of the world, p(x), the pattern of inputs it was shown. When the production distribution p(x) slides away from that snapshot, the model keeps applying a function fit to data that no longer exists. Accuracy degrades even though not a single weight has been updated (Dataset Shift in ML).
Formally, the most common case is Covariate Shift: the input distribution p(x) moves while the relationship between inputs and labels, p(y|x), holds steady (Dataset Shift in ML). Its mirror image is Label Drift, also called prior probability shift, where the mix of outcomes p(y) changes while each class’s feature signature p(x|y) stays put. A spam filter sees covariate shift when spammers invent new phrasings; it sees label drift when the sheer ratio of spam to real mail swings during a holiday campaign.
Both differ from concept drift, where the underlying relationship p(y|x) itself rewires and the same input should now map to a different answer. Data drift is the world changing its inputs; concept drift is the world changing its rules. Keep them separate, because they call for different fixes and conflating them sends you chasing the wrong cause.
The unifying idea is uncomfortable but clean: the model is frozen, the data is not. Training ends, the parameters lock, and from that moment the model is a fixed bet on a distribution that has no obligation to stay still.
Why a Static Boundary Slowly Bleeds Accuracy
A trained model is a decision boundary carved through the geometry of its training data. That boundary was placed precisely where the examples were dense. The question is what happens when the examples stop arriving where the boundary expects them.
How does data drift degrade model performance over time?
Degradation happens because the model interpolates confidently in regions it learned and extrapolates blindly in regions it did not. While production inputs land inside the training distribution, predictions stay reliable. As inputs migrate into sparsely-seen territory, the model still returns an answer, and the answer still looks confident, because a softmax will happily assign high probability to a region the model barely understands. The probability mass is real; the calibration behind it has quietly rotted.
This is why drift is so dangerous in practice: degradation is gradual, silent, and confident. There is no exception thrown, no error logged, no crash to page an on-call engineer. The model assigns high probability to outputs that are increasingly wrong, and from the outside the system looks healthy. The error rate climbs one misclassification at a time, slow enough that a weekly metric barely twitches.
Covariate shift and label drift corrupt accuracy through different doors. Under covariate shift, inputs drift into thin regions and the boundary, fit elsewhere, slices through them awkwardly. Under label drift, the base rates move, so a classification threshold tuned for the old class balance now mis-trades precision against recall. The geometry was correct for a world that has since been replaced.
The honest version of this story marks its own boundary. The mechanism predicts that accuracy will decay once inputs leave the training region; it does not promise how fast. That depends on how steep the decision boundary is where the drift lands, how far the distribution moves, and how much of the action concentrates in features the model actually weighted. The decay is reliable in direction, uncertain in rate.
Catching Drift Before Your Users Do
You cannot fix what you cannot see, and accuracy itself is often invisible in production because the true labels arrive late, if at all. Did that approved loan default? You will know in three years. So Model Monitoring leans on a proxy you can measure immediately: the distance between the training distribution and the live one, computed feature by feature.
The standard toolkit all answers one question, how far has p(x) moved, with different mathematics. The Kolmogorov-Smirnov Test compares two distributions by their largest cumulative gap. Wasserstein Distance measures how much probability mass you would have to physically move to turn one distribution into the other. KL Divergence and Jensen-Shannon distance score the information lost when you approximate the live distribution with the training one. These are the methods most monitoring tools reach for, auto-selecting one per feature by data type and sample size (Evidently Docs).
The most common single number teams watch is the Population Stability Index, or PSI. A rough industry convention reads PSI below 0.1 as negligible, 0.1 to 0.25 as worth investigating, and above 0.25 as a real shift that demands action (Fiddler AI). Treat those cutoffs as a calibrated rule of thumb, not a statistical law, and recalibrate them per domain. Tools aggregate the same way: Evidently, for instance, flags an entire dataset as drifted once at least half of its columns drift (Evidently Docs).
A handful of open-source libraries have turned this monitoring into standard practice, and they disagree about what to measure. Evidently AI is the broadest, spanning over a hundred metrics across tabular, text, and LLM data; its current release is v0.7.21 (Evidently on PyPI). NannyML takes the most opinionated stance: it estimates post-deployment accuracy without waiting for ground-truth labels, then mutes drift alerts that do not actually move performance, a direct countermeasure to alert fatigue (NannyML Docs). Whylogs leans on lightweight, mergeable data profiles, which makes it natural for streaming and distributed pipelines. Alibi Detect covers outlier, adversarial, and drift detection with kernel-based tests.
One caution on tooling longevity. Evidently, NannyML, and whylogs are actively developed open-source projects; Alibi Detect now describes itself as source-available, and its release cadence has slowed to roughly once every couple of years, which reads closer to maintenance mode than active feature work (Alibi Detect’s GitHub). If you need a library that will keep tracking new drift methods, the first three are the safer bets.
None of these tools closes the loop on their own. A drift score tells you the inputs moved; it cannot tell you whether that movement reached the decision boundary. No single test proves the drift matters to your accuracy, which is exactly why the next question is the important one.
What a Drift Alert Actually Predicts
Once you see the mechanism as a frozen boundary meeting a moving distribution, a drift dashboard stops being a wall of red and green and starts making testable predictions about your own pipeline.
- If your input features drift but accuracy holds, the drift is landing where the decision boundary is flat. It is real movement, harmless for now, and not yet worth retraining over.
- If accuracy drops while your monitored features look stable, suspect label drift or concept drift rather than covariate shift. The inputs did not move; the meaning did, and a p(x) detector is blind to that.
- If a single feature lurches overnight instead of gliding over weeks, suspect a pipeline bug before you suspect the world. Distributions in the wild usually drift; they rarely teleport.
That last case matters more than it sounds. Not every alert is drift. Sometimes a distribution “shifts” because an upstream join started folding a future-derived field into your features, which is closer to Data Leakage than to any genuine change in the world. Model Retraining on that data would bake the bug straight into the weights, so the first response to an alert is diagnosis, not a retrain.
Rule of thumb: monitor the inputs you can see continuously, but trust accuracy only as far as your fresh labels reach. Drift detection buys you warning time, not a verdict.
When it breaks: drift detection sees the inputs and never the labels, so it can scream about a harmless distribution shift while staying silent on genuine concept drift that arrives with no visible input change. A green dashboard is not proof the model is still right. It is only proof that the inputs still look familiar.
The Data Says
Data drift is not model failure; it is the slow divergence between a frozen function and a moving world. The statistics that catch it, from PSI to the Kolmogorov-Smirnov test to Wasserstein distance, all measure the same thing, the distance p(x) has traveled, and none of them tells you whether that distance has reached the decision boundary. The teams that survive drift monitor the gap continuously and treat every alert as a question to investigate, not an answer to act on blindly.
AI-assisted content, human-reviewed. Images AI-generated. Editorial Standards · Our Editors