What Is AI-Assisted Debugging and How LLMs Analyze Stack Traces to Find Bugs
Table of Contents
ELI5
AI-assisted debugging is the use of large language models to read errors, stack traces, and runtime evidence — then propose targeted fixes inside a feedback loop that a developer verifies before anything ships.
A junior engineer pastes a forty-line stack trace into a chat box. Three seconds later, the model points at a specific file, a specific line, and a specific off-by-one in a date parser nobody had touched in two years. The fix is right. The reasoning, when you read it back, looks suspiciously like what a senior debugger would have written — except no human read the trace.
That reaction — “how did it know?” — is the wrong question. The interesting question is the one underneath it: what exactly is the model doing with that pile of frames, and what is it not doing?
What Everyone Gets Wrong About AI Debuggers
Myth: The model “understands” the bug. Reality: The model is performing pattern-matched inference over the textual surface of the error, the source files it can reach, and any runtime signals you feed it. There is no causal model of your program inside the weights. Symptom in the wild: Confident, well-formatted fix suggestions for bugs the model has never actually verified. The classic failure mode is a plausible-looking patch that compiles, reads cleanly, and does nothing to address the underlying defect.
The mechanism is more interesting than the magic. Once you see what’s actually happening, the failure modes stop being mysterious — they become predictable.
The Anatomy of a Bug, Seen From a Probability Distribution
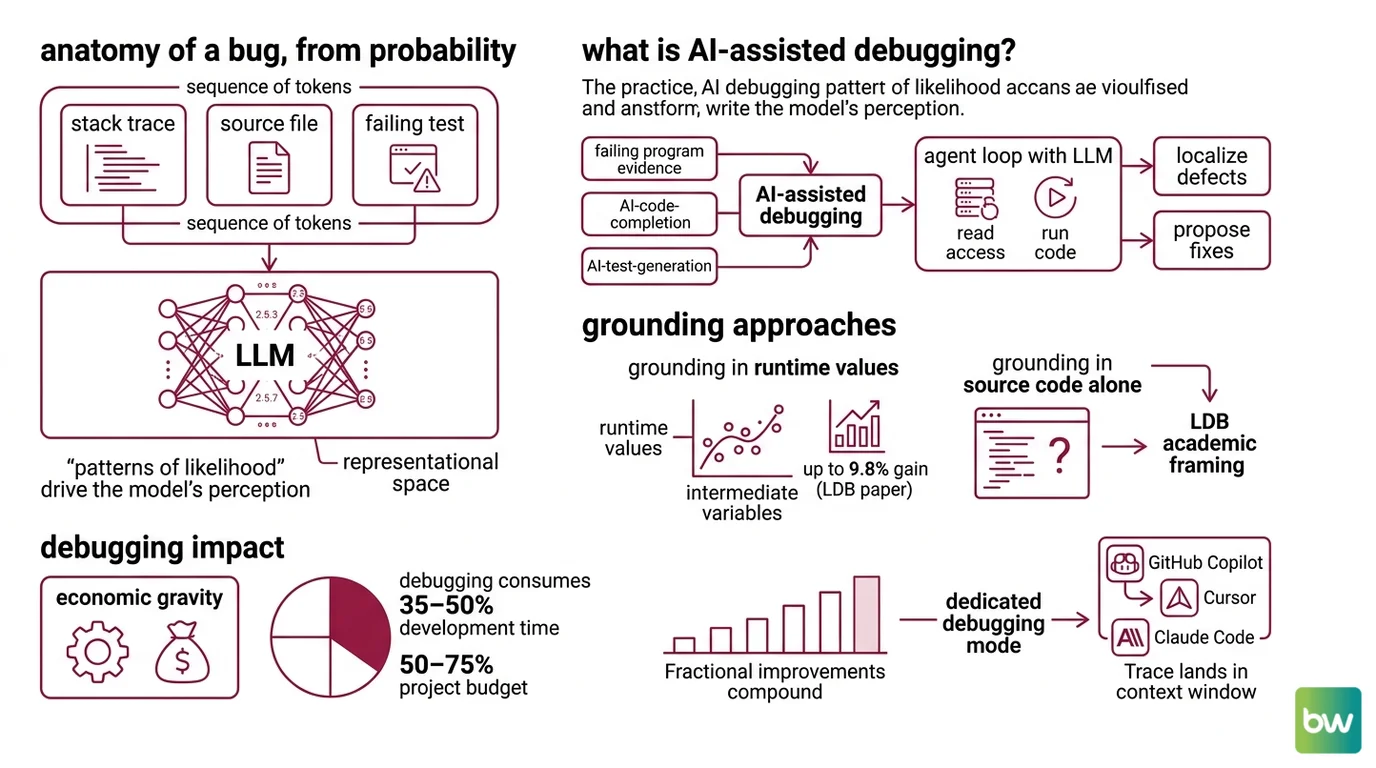
A stack trace is, structurally, a sequence of tokens. A source file is a sequence of tokens. A failing test output is a sequence of tokens. To an LLM, all three live in the same representational space — the model does not distinguish “evidence” from “code” the way a debugger built on gdb semantics would. It distinguishes only patterns of likelihood.
That framing changes everything that follows.
What is AI-assisted debugging?
AI-assisted debugging is the practice of using a large language model — usually inside an agent loop with read access to source files and, increasingly, the ability to run code — to localize and propose fixes for software defects. It sits alongside related disciplines like AI Code Completion, AI Code Review, and AI Test Generation, but its primary input is not future code; it is evidence of failure.
The canonical academic framing comes from the LDB paper (Zhong, Wang, Shang 2024), which segments a failing program into basic blocks and tracks intermediate variable values across runtime execution. The reported gain over a baseline was up to 9.8% on HumanEval, MBPP, and TransCoder benchmarks — modest in absolute terms, but methodologically important. It established that grounding an LLM in actual runtime values outperforms grounding it in source code alone.
Debugging itself is not a small target. The DebugBench paper restates earlier software-engineering studies estimating that debugging consumes 35–50% of development time and 50–75% of total project budget. Even fractional improvements compound. That economic gravity is why every major coding assistant — GitHub Copilot, Cursor, Claude Code — has shipped a dedicated debugging mode over the past two years.
But “dedicated debugging mode” is a category, not a mechanism. Underneath, they all do roughly the same thing.
What Happens When the Trace Lands in the Context Window
The first move is unglamorous: the stack trace becomes input tokens. Every frame, every file path, every line number, every “Caused by” line — tokenized. The model now has a textual artifact whose distribution closely matches millions of similar artifacts in its training data.
This is the part that feels like magic and isn’t. The model has seen NullPointerException at com.example.UserService.findById(UserService.java:47) in approximately the form it appears in your terminal, tens of thousands of times. It has seen what fixes typically follow. It has seen which frames usually matter and which are noise.
Not telepathy. Conditional probability over a training corpus that included Stack Overflow, GitHub issues, public repositories, and bug-tracker exports.
How does AI-assisted debugging work under the hood?
Inside an agent loop, the mechanism splits into roughly five steps — the cleanest published version is Cursor’s Debug Mode loop, which makes the structure explicit:
- Explore and hypothesize. The agent reads the error, identifies suspect files via the stack frames or symbol names, and generates one or more candidate hypotheses about the root cause.
- Instrument. Rather than guessing, the agent inserts log statements or assertions at points where its hypotheses predict different behaviors will diverge.
- Request reproduction. The agent asks the developer to run the failing scenario. This step is structural, not optional — the model has no way to invoke the user’s environment on its own.
- Analyze runtime evidence. The new logs come back. The agent compares observed values against what each hypothesis predicted, narrowing down which one survives the evidence.
- Apply a targeted fix and clean up. The agent edits the offending code, removes its instrumentation, and returns the file to a shippable state.
That loop — described in Cursor Docs and reflected, with different vocabulary, in GitHub Copilot’s agentic debugger workflow shipped in the Visual Studio April 2026 update — is the operational core of modern AI debugging. The LLM is the inference engine; the loop is the scaffolding that keeps inference honest.
The key word is honest. Without instrumentation and reproduction, the model is generating plausible fixes against a textual artifact. With them, it is generating fixes against measured behavior. Those are not the same thing. The first is pattern completion. The second is something much closer to what a working engineer would call debugging.
GitHub’s documentation describes the simpler, single-shot version of the same idea: Copilot reads the error message, identifies the underlying cause, analyzes outputs for logic errors, and proposes corrected code via Copilot Chat (GitHub Docs). That works for tractable cases — typos, obvious null dereferences, off-by-ones with clear stack frames. It breaks down the moment the bug requires understanding state that isn’t in the trace.
Inside the Loop: The Pieces That Make It Work
A stack trace alone does not constitute a debugger. The model needs surrounding machinery to turn token-level inference into something a developer can trust. The vendor implementations differ in detail but converge on a small set of components.
What are the components of an AI debugging assistant?
Across the available systems — Cursor Debug Mode, GitHub Copilot’s agentic debugger, Claude Code — the architecture decomposes into four moving parts:
| Component | Function | Why it matters |
|---|---|---|
| Evidence parser | Tokenizes errors, stack traces, test failures, and CI output | This is the raw signal. Everything downstream conditions on it. |
| Hypothesis generator | The LLM itself, sampling plausible root causes given evidence + source context | Where conditional probability does its work. Multiple hypotheses beat one. |
| Instrumentation layer | Inserts logs, breakpoints, or assertions to discriminate between hypotheses | Converts speculation into measurement. |
| Runtime feedback channel | Captures the output of a re-run and feeds it back into the loop | Closes the loop. Without it, the agent is guessing forever. |
The instrumentation layer is the component that most distinguishes 2026-era debuggers from their predecessors. Cursor Docs describes a local debug server inside the Cursor extension that handles dynamic log instrumentation and multi-hypothesis generation. GitHub Copilot’s April 2026 update validates bugs against real runtime behavior — reproducing, instrumenting, diagnosing, and suggesting fixes through live execution (GitHub Changelog). Claude Code closes the loop differently: it reads test failures, fixes code, and re-runs the test suite until passing, with the option to monitor CI on GitHub or GitLab and commit fixes automatically (Anthropic Product).
Each vendor has its own surface vocabulary. The underlying loop is the same shape.
One detail Cursor’s documentation is explicit about: it does not specify how the agent internally parses a stack trace. The general pattern — tokenize the trace, locate the top user-code frame, follow file paths into the surrounding source — is inferable from the published behavior, but the vendor-specific internals are deliberately opaque. Treat any “the agent parses traces by…” claim that goes beyond this as speculation.
What the Loop Predicts About Failure
Once you see the mechanism, the failure modes become predictable rather than mysterious. The loop has clear assumptions, and when those assumptions break, the output degrades in specific ways.
- If the bug’s evidence is not in the stack trace — for instance, a race condition that only manifests under load — expect the model to hallucinate a plausible-looking fix that compiles, reads cleanly, and changes nothing about the underlying defect.
- If the relevant source files are not in the model’s context, expect symptoms-in-the-wrong-place fixes: the model patches what it can see, not what is actually broken.
- If you skip the instrumentation step and ask for a fix directly from the trace, expect the success rate to track what would be achievable by a human reading only the trace — which, for non-trivial bugs, is poor.
- If you rely on the model’s confidence as a signal, expect calibration failure. The model produces equally fluent output for cases it has nailed and cases it has fabricated. Confidence is a stylistic property of the generation, not an epistemic one.
The practical consequence: AI debugging is most useful when the bug leaves a clear textual fingerprint and least useful when the bug lives in timing, environment, or state that the trace cannot capture. The smarter the agent loop — meaning the more instrumentation and reproduction it can perform — the wider the band of bugs it covers. But the asymptote is still bounded by what is observable.
Rule of thumb: Trust the suggestion when the model has touched runtime evidence. Verify with skepticism when it has only touched text.
When it breaks: The loop fails predictably on concurrency bugs, environment-dependent defects, and any defect whose root cause is outside the file paths the model can reach. No amount of prompt engineering compensates for evidence the agent cannot observe.
The Geometry of Why It Works At All
There is a deeper reason this approach is effective despite the model having no causal model of your program. Bugs are not uniformly distributed. They cluster — both in code (the same patterns produce the same defects repeatedly) and in expression (a Java NullPointerException looks structurally similar across millions of projects). The training distribution captures this clustering. The model is not solving an arbitrary inference problem; it is solving a problem whose statistical structure is dense in the data.
That is why stack-trace analysis is not formally benchmarked as a separate capability in surveys like CodeLLMSurvey and AwesomeLLM4SE — it is treated as a sub-task inside the broader program-repair problem. Separating it would imply it has its own distinct mechanism. It does not. It is the same conditional-probability machinery applied to a particularly information-dense input.
The bugs you are most likely to encounter look, statistically, a great deal like bugs the model has already seen. The bugs you are least likely to get help with are the ones that look like nothing it has seen before.
The Data Says
AI-assisted debugging is a probabilistic process scaffolded into a deterministic-looking loop. The probability comes from the LLM doing what it has always done — conditional generation over tokens. The determinism comes from the loop forcing that generation to be tested against runtime evidence before any code changes. Strip away the loop, and you have an autocomplete on top of an error message. Keep the loop, and you have something that genuinely shortens the distance between a failing test and a passing one — within the bounds of what the evidence can show.
AI-assisted content, human-reviewed. Images AI-generated. Editorial Standards · Our Editors