What Is Agent Observability? Traces, Spans, and Token Attribution
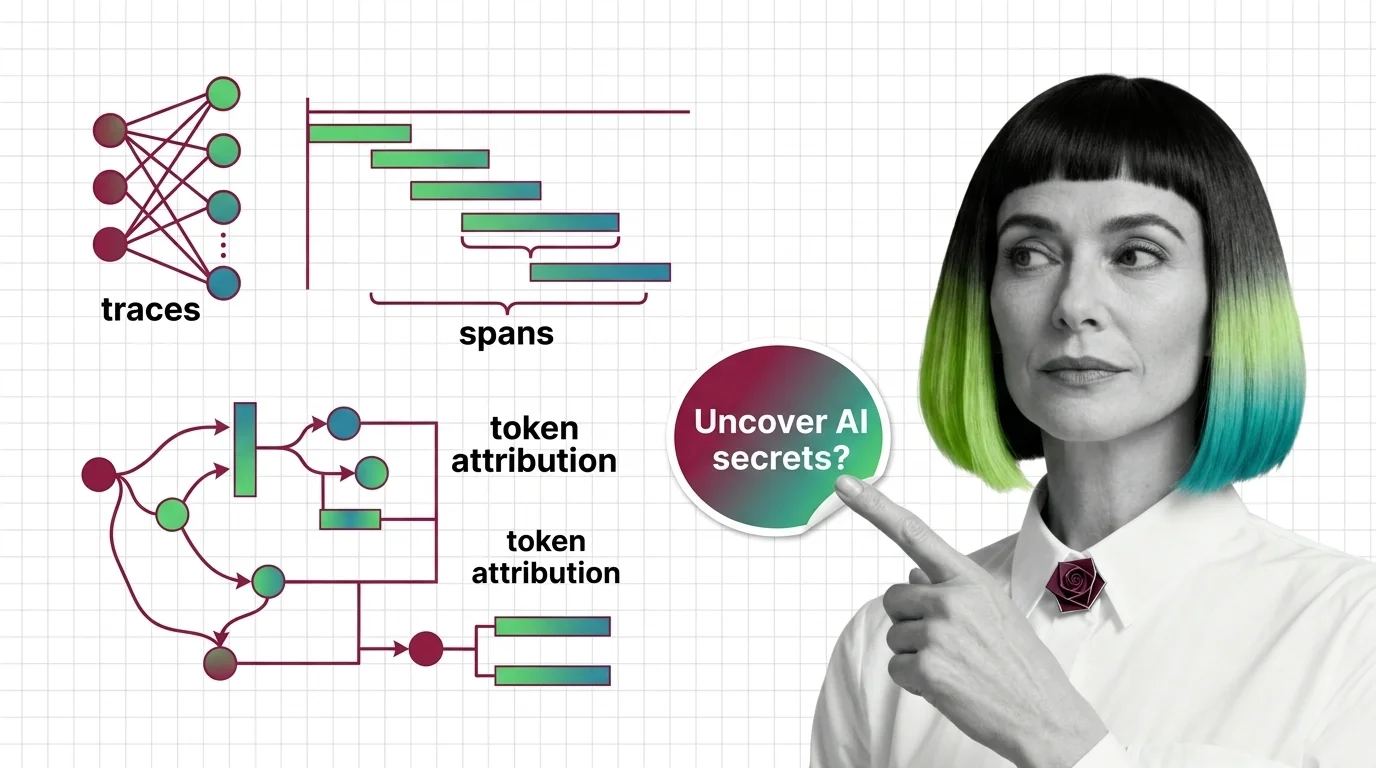
Table of Contents
ELI5
Agent observability is the practice of recording every step an AI agent takes — each LLM call, each tool invocation, each retrieval, each decision — as a structured trace you can replay, measure, and diagnose long after the agent finished running.
A senior engineer once told me the moment an agent goes from interesting to terrifying is the moment it works. Until then, you stare at logs that say “called tool, got result.” After that, the same logs are still all you have — except now the agent has made forty calls, branched twice, refunded a customer, and you have no idea why. The bug isn’t in the model. The bug is that you cannot see what the model did.
That gap is what agent observability was built to close.
The Visibility Problem Underneath Agent Systems
Traditional application monitoring assumes a deterministic call graph. Service A calls Service B, B calls C, and the structure of the request is encoded in your code. Agents break that assumption. The control flow lives inside a probability distribution over the next token, and the same prompt can produce a three-step plan today and a seven-step plan tomorrow.
This is not a debugging convenience problem. It is an epistemology problem.
You cannot ask “what did the agent decide” by reading source code, because the decisions are not in the source. They are in the activation pattern of a model you do not own, conditioned on a context window you assembled at runtime. The only durable record of what happened is the record you write yourself, while it happens.
What is agent observability?
Agent observability is the discipline of instrumenting an AI agent so that every reasoning step, tool call, retrieval, and token-level cost becomes a structured, queryable artifact — a trace — rather than a line of unstructured stdout. The four pillars of an agent trace, as articulated by LangChain, are LLM calls, tool calls, retrieval steps, and reasoning transitions (LangChain). Lose any one of them and you lose the ability to reconstruct cause.
The distinction matters because LLM observability and agent observability are not the same thing. LLM observability records a call: a prompt went in, tokens came out, here are latency and cost. Agent observability records the causal chain between calls: which retrieval produced the context that influenced the plan that selected the tool whose failure triggered the retry that finally produced the answer.
One is a receipt. The other is a transcript.
Adoption suggests the industry has noticed. LangWatch cites a “State of Agent Engineering” survey claiming 89% of organizations report some form of agent observability and 62% have detailed step-level tracing — though the underlying methodology was not independently verified, so treat the precise figures as directional rather than load-bearing.
The Anatomy of a Trace
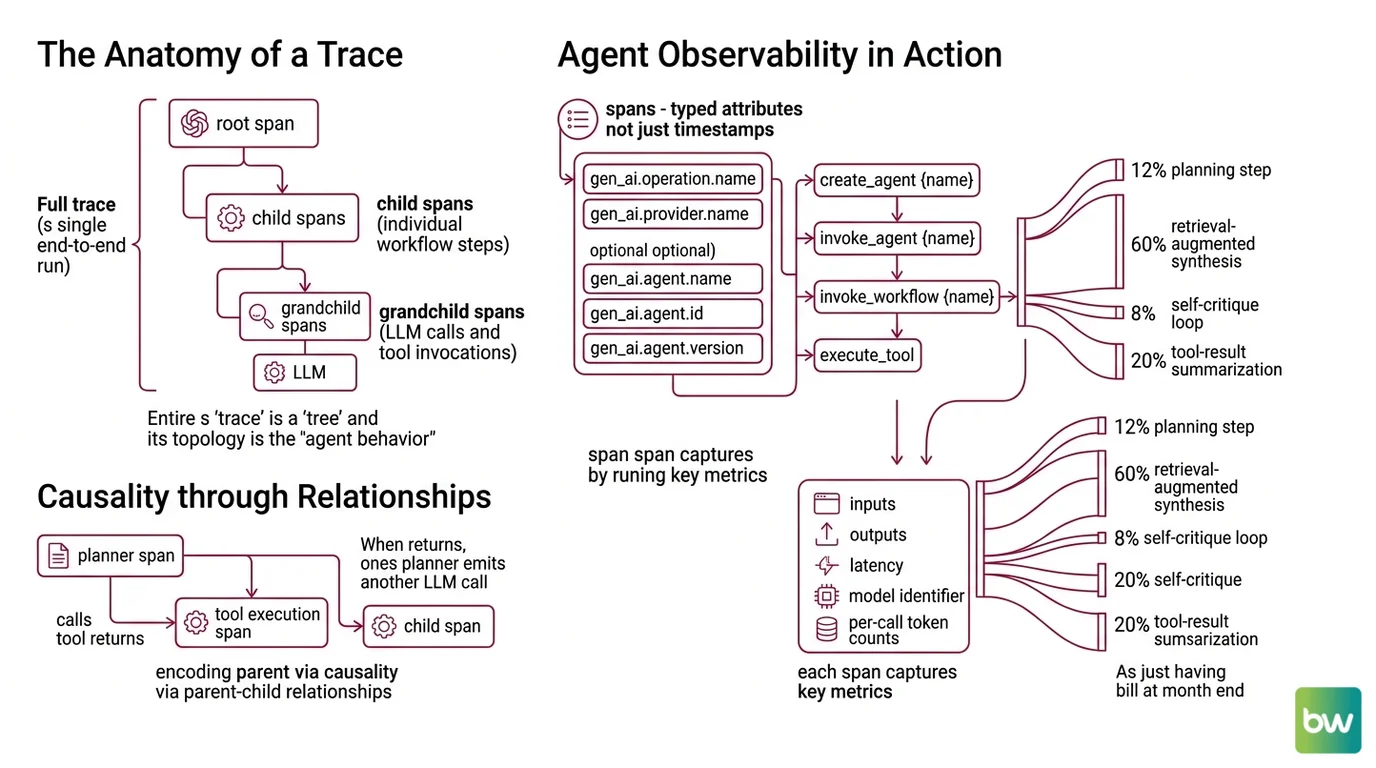
Before getting to mechanism, it helps to fix the vocabulary. A trace is the full record of one end-to-end run — a single user request, a single autonomous goal, a single workflow execution. A span is one operation inside that trace. Spans nest. The root span contains the whole workflow; child spans contain its steps; grandchild spans contain the LLM calls and tool invocations inside each step. A trace, in other words, is a tree, and the topology of that tree is the agent’s actual behavior — not the behavior you imagined when you wrote the prompt.
How does agent observability work across multi-step LLM traces?
The trick is that spans carry typed attributes, not just timestamps. The OpenTelemetry GenAI semantic conventions define which attributes describe an agent operation: gen_ai.operation.name and gen_ai.provider.name are required, with conditional attributes like gen_ai.agent.name, gen_ai.agent.id, and gen_ai.agent.version providing identity (OpenTelemetry Docs). Span name patterns follow a small alphabet — create_agent {name}, invoke_agent {name}, invoke_workflow {name}, and execute_tool — so that any compliant backend can recognize the shape of an agent trace without reading proprietary tags.
Each span captures inputs, outputs, latency, model identifier, and per-call token counts. The token counts are the part that often surprises people. Token attribution at the span level lets you draw a Sankey diagram of where the budget went: 12% in the planning step, 60% in the retrieval-augmented synthesis, 8% in the self-critique loop, 20% in a tool-result summarization step you forgot you added. Without span-level attribution, the only number you have is the bill at the end of the month.
A trace also encodes causality through parent-child relationships. When the planner span calls a tool, the tool execution span is its child; when the tool returns and the planner emits another LLM call, that new call is also the planner’s child, ordered after the tool span. Replay a trace and you reconstruct not just the what but the because.
Two things make this harder than classical distributed tracing. First, the inputs and outputs are unstructured text, sometimes megabytes of it, so naive logging blows up storage and slows the agent. Second, the interesting causal links are semantic — “the retrieval returned doc-7, which mentioned the refund policy, which is why the agent invoked the refund tool” — and that chain crosses a black box. The best the trace can do is capture both ends of the link cleanly and let you, or an evaluator, infer the middle.
What are the core components of an agent observability stack?
A working stack has five components, and they tend to be confused with each other because some platforms bundle several into one product.
The instrumentation layer is the SDK or auto-instrumentation that emits spans from inside your agent runtime. This is where OpenTelemetry GenAI conventions and Arize’s OpenInference conventions live. OpenInference is a concrete attribute schema and span-kind taxonomy that sits on top of OTel — every OpenInference trace is a valid OTLP trace, and span processors can translate between OpenInference and OTel GenAI (OpenInference GitHub). Two overlapping standards still co-exist; choose one per service and translate at the edge.
The transport layer is the OTLP exporter that ships spans to a collector. This is the same machinery your APM already speaks, which is why Datadog LLM Observability can natively support OTel GenAI Semantic Conventions starting in v1.37+ (Datadog Blog) — the wire format is identical to traces from a Java service.
The storage and query layer is the trace backend: indexed by trace ID, queryable by attribute, with retention policies long enough to support post-hoc evaluation. This is the seam where vendor choices show up. Langfuse is MIT-licensed and OTel-native with full feature parity between self-hosted and cloud (Langfuse), so the storage layer can live entirely on your infrastructure. Arize Phoenix is open-source and OpenTelemetry-native using OpenInference conventions (Arize Phoenix Docs) for the same reason from a different starting point.
The evaluation layer turns stored traces into judgments. LLM-as-a-judge evaluators, regression suites, and annotation queues all read the same span data and write back labels — “this answer hallucinated,” “this tool call was unnecessary,” “this step took 14 seconds and shouldn’t have.” In June 2025, Langfuse moved LLM-as-a-judge evals, annotation queues, prompt experiments, and Playground to MIT (Langfuse); older blog posts describing these as paid-only are outdated.
The interface layer is the part operators actually touch: the timeline view, the diff between two runs, the cost dashboard, the alerting rules. Agent Evaluation And Testing feeds the evaluation layer; Agent Guardrails reads from the trace stream to enforce policy at runtime; Human In The Loop For Agents workflows route ambiguous traces to human reviewers through the interface layer.
These components are not optional, but they do not have to come from the same vendor. The genuine cost of fragmentation is the schema mismatch between layers — which is exactly why the OTel and OpenInference standards exist.
What the Trace Predicts About Failure
Once you have spans, the structure of the trace itself becomes diagnostic. The same questions you used to answer by re-running an agent and watching can now be answered by querying past traces.
If a single agent run produces a trace with hundreds of LLM-call spans and no tool spans, you are almost certainly in a planning loop where the model talks to itself without acting. If retrieval spans dominate cost but rarely appear in the context window of the next LLM span, your retriever is firing but its results are being thrown away. If the same tool span fails three times in a row before a success, the agent has learned to brute-force around a flaky dependency rather than report it.
If you change the system prompt and the average number of tool spans per trace doubles, you have shifted the agent’s policy without intending to. If the median latency of LLM spans grows while p99 stays flat, the model provider is throttling — not your code regressing. If token attribution shifts five percent toward a self-critique span you added last week, that critique is doing real work; if it shifts twenty percent, the critique is now the main cost center.
Rule of thumb: treat each span attribute as a hypothesis. The trace is not the answer; it is the dataset against which questions become answerable.
When it breaks: the most common failure mode is silent data loss in the trace itself. If your instrumentation samples too aggressively, redacts too much for privacy, or drops large prompts to save storage, the replay you depend on for debugging is no longer faithful. Token counts can also disagree across providers and SDK versions, which means cost attribution is approximate, not authoritative — useful for trends, dangerous for chargeback without reconciliation.
Security & compatibility notes:
- OpenTelemetry GenAI semantic conventions: Still in Development status as of May 2026. Attribute names and span shapes can change before stabilization. Pin instrumentation versions and use
OTEL_SEMCONV_STABILITY_OPT_INto control dual-emission across version transitions; instrumentations on 1.36.0 or earlier hold prior conventions unless they opt intogen_ai_latest_experimental(OpenTelemetry Docs).- OpenInference vs OTel GenAI: Two overlapping conventions co-exist. Phoenix consumes OpenInference natively; OTel GenAI is the upstream standard. Translation requires span processors at the boundary.
- Token attribution algorithms: No single industry-wide standard exists — each platform counts and attributes tokens slightly differently. Avoid presenting a single platform’s number as canonical.
The Standard Behind the Standards
The deeper reason agent observability is becoming a discipline rather than a vendor feature is that the data layer has converged faster than the application layer. OTLP — OpenTelemetry’s wire protocol — is now spoken by every serious observability backend, and the GenAI semantic conventions extend it into agent territory.
That convergence has a consequence MONA finds satisfying. The bet on observability stops being a bet on a vendor and starts being a bet on a schema. If you instrument once with OTel GenAI conventions, the cost of swapping Langfuse for Phoenix for Datadog is real but bounded — schema-bounded. If you instrument with a proprietary SDK, the cost is unbounded; you are buying lock-in disguised as convenience.
Not a vendor choice. A schema choice.
The Data Says
Agent observability is what turns a non-deterministic system into one you can reason about. Traces externalize the agent’s behavior, spans give that behavior a queryable shape, and token attribution turns invisible cost into a number you can defend. The technology is converging on OpenTelemetry GenAI conventions, but the conventions are still in development — the schema is the right bet, the specific attribute names are not yet stable.
AI-assisted content, human-reviewed. Images AI-generated. Editorial Standards · Our Editors