What Are Bias and Fairness Metrics and How They Detect Discrimination in ML Predictions
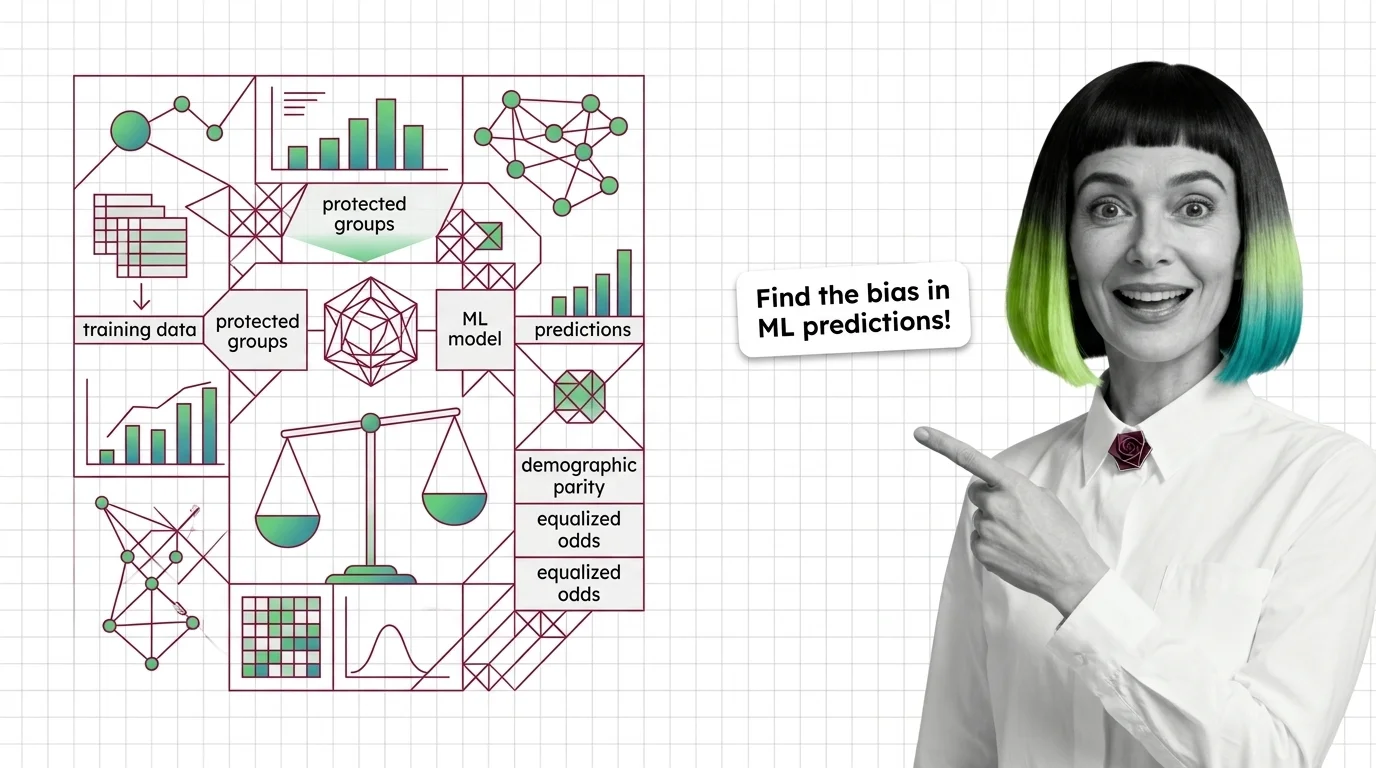
Table of Contents
ELI5
Bias and fairness metrics are mathematical tests that check whether a model’s predictions treat different demographic groups equitably — or whether high accuracy is hiding systematic discrimination.
A credit scoring model posts strong accuracy. The team signs off. Months later, an audit reveals it denies applicants from one demographic group at more than double the rate of another — while the overall performance number never moved. Accuracy didn’t lie. It simply measured the wrong thing.
That gap — between aggregate performance and group-level harm — is exactly where fairness metrics operate. They ask a question that accuracy was never designed to answer: does this model treat every group the same way, and if not, by how much?
What “Fair” Means When the Math Has Three Answers
The awkward truth about fairness in machine learning is that the word “fair” does not have one mathematical definition. It has at least three, and they pull in different directions.
What are bias and fairness metrics in machine learning?
Bias and fairness metrics are quantitative tests applied to a model’s predictions to determine whether outcomes differ systematically across groups defined by a Protected Attribute — race, gender, age, disability status. They sit in the evaluation layer, after the model has been trained, and they answer a structural question: does the distribution of predictions look the same for Group A as it does for Group B?
The standard taxonomy splits group fairness into three criteria (Fairlearn Docs):
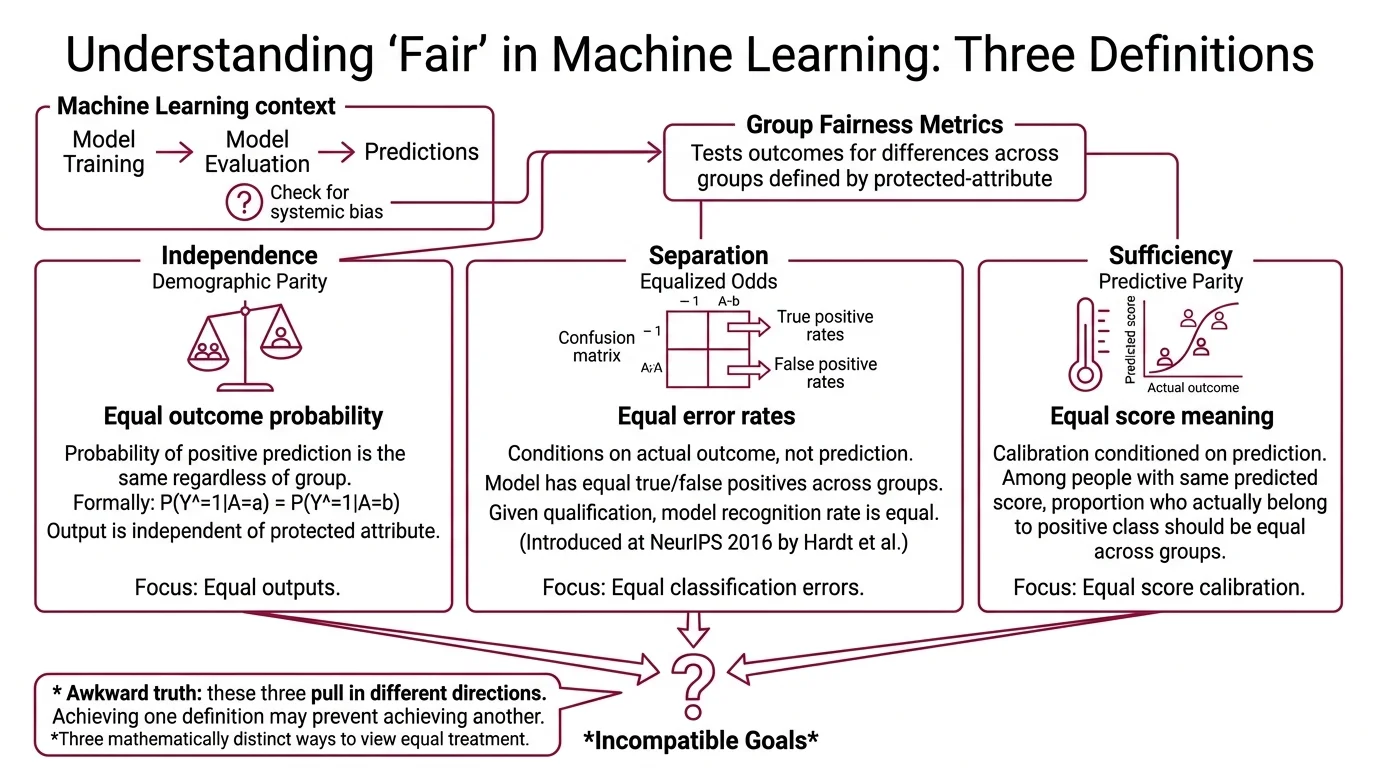
Independence (demographic parity) — the probability of a positive prediction should be the same regardless of group membership. Formally: P(Ŷ=1|A=a) = P(Ŷ=1|A=b). The model’s output distribution should be statistically independent of the protected attribute.
Separation (equalized odds) — the model should have equal true positive rates and equal false positive rates across groups. This conditions on the actual outcome, not just the prediction. Introduced by Hardt, Price, and Srebro at NeurIPS 2016 (Hardt et al.), separation asks: given that someone actually qualifies, does the model recognize them at the same rate regardless of group?
Sufficiency (predictive parity) — among people who receive the same predicted score, the proportion who actually belong to the positive class should be equal across groups. This is calibration, conditioned on the prediction.
Each criterion captures a different intuition about equal treatment. Independence says: equal outcomes. Separation says: equal error rates. Sufficiency says: equal meaning of the score.
The problem is that these are not three views of the same concept. They are three mathematically distinct definitions that compete with each other — and satisfying all of them simultaneously is, in most real-world scenarios, provably impossible.
Splitting the Prediction Table by Group
Think of a standard Confusion Matrix — true positives, false positives, true negatives, false negatives — as a single balance sheet. It tells you how the model performed overall. Fairness metrics take that balance sheet and break it into separate ledgers, one per group. The disparities that were invisible in the aggregate suddenly have nowhere to hide.
How do fairness metrics detect bias in model predictions across protected groups?
The detection mechanism is straightforward in principle: compute the same performance metric separately for each protected group, then compare. The metric itself doesn’t change. The lens does.
For equalized odds, you compute the true positive rate and false positive rate for each group independently. If your model correctly identifies qualified applicants from Group A at a high rate but catches substantially fewer from Group B — same model, same threshold — the separation criterion fails. The bias is conditional on the true label, meaning the model is not just producing different outcomes; it is making different kinds of errors for different people.
Demographic parity takes a blunter approach. It does not look at the true label at all. It asks only whether the rate of positive predictions is the same across groups. This makes it easier to compute and easier to game — a model could satisfy demographic parity by randomly assigning favorable predictions to the underrepresented group, which satisfies the statistic while destroying individual accuracy.
Not a measurement problem. A definition problem.
In practice, detection relies on toolkits. AI Fairness 360 (v0.6.1, as of April 2024) provides bias mitigation algorithms and metric computation across the pre-processing, in-processing, and post-processing stages (AIF360 GitHub). Fairlearn (v0.13.0, released October 2025) integrates with scikit-learn and emphasizes assessment-first workflows — measure the bias before attempting to mitigate it.
Compatibility note:
- AIF360: No release since April 2024; Python 3.12 is not yet officially supported. Verify compatibility before integrating into newer environments.
The detection step is not the hard part. Choosing which metric to detect against — that is where the real decisions begin.
From Employment Law to Model Audits
Before machine learning had its own fairness vocabulary, employment law had already formalized one specific test. The Four Fifths Rule, codified in the EEOC Uniform Guidelines on Employee Selection Procedures in 1978, states that a selection procedure is presumptively discriminatory if the selection rate for any group is less than four-fifths of the rate for the highest-performing group (EEOC Guidelines).
How does disparate impact analysis work in machine learning models?
Disparate Impact analysis translates that legal standard into a quantitative ratio. Take the favorable outcome rate for the unprivileged group and divide it by the favorable outcome rate for the privileged group. The result is the disparate impact ratio. An ideal ratio is 1.0 — perfectly equal rates. A ratio below 0.8 signals a potential violation of the four-fifths threshold (Fairlearn Docs).
The calculation is mechanical. Suppose a hiring model recommends candidates from two groups. If Group A gets recommended at a higher rate than Group B, and the ratio of Group B’s rate to Group A’s rate falls below 0.8, the model has a disparate impact problem — even if it was never explicitly told which group anyone belongs to.
This is the quiet part of algorithmic discrimination: you don’t need a protected attribute in the feature set for the model to discriminate on it. Proxy variables — zip code, school name, browsing patterns — can reconstruct the protected attribute indirectly. The disparate impact ratio catches the effect regardless of the pathway.
One caveat worth naming: the four-fifths rule originated in employment selection, and the Fairlearn documentation explicitly warns against applying it as a universal fairness standard outside that context. It is a useful heuristic with a specific legal lineage, not a general law of machine learning.
When Three Definitions Cannot Share a Room
Here is where the math turns uncomfortable.
In 2017, Alexandra Chouldechova proved that when base rates differ across groups — and they almost always do — a model cannot simultaneously achieve predictive parity and equal error rates (Chouldechova (2017)). Separately, Kleinberg, Mullainathan, and Raghavan showed that three natural fairness conditions (calibration plus balance for positive and negative classes) are mutually exclusive except in degenerate cases.
This is the Impossibility Theorem of algorithmic fairness.
Not a limitation of current tools. A mathematical constraint.
Approximate relaxations have been proposed — the conditions soften when base rates are close across groups — but the fundamental tension persists in most real-world distributions where the groups you care about differ precisely because their base rates are unequal.
The practical consequence is that every fairness intervention is a trade-off. You choose which definition of fairness matters most for your application — and you accept that the other definitions will be violated. A recidivism model optimized for equal false positive rates will have unequal predictive parity. A loan model calibrated equally across groups will produce unequal approval rates when base rates differ.
Counterfactual Fairness offers a different angle entirely. Rather than comparing group statistics, it asks: would this individual have received the same decision if their protected attribute were different, all else held constant? Formalized by Kusner et al. at NeurIPS 2017 (Kusner et al.), it requires a causal model of the data-generating process — which makes it theoretically elegant and practically demanding.
The EU AI Act, with high-risk bias requirements taking effect in August 2026, mandates pre-deployment fairness evaluation for high-risk systems. The regulation does not prescribe which fairness metric to use — which means the choice of definition remains an engineering decision, and the trade-offs that follow from it belong to the team that built the model.
Rule of thumb: Start with the fairness criterion that matches the harm you are trying to prevent. If false positives cause the most damage (wrongful denial), optimize for equalized false positive rates. If outcome rates carry legal or political weight, start with demographic parity.
When it breaks: Fairness metrics assume that group membership is known and binary. When protected attributes are missing, self-reported, intersectional, or continuous, the metrics lose resolution. A model might pass every fairness test for gender and for race independently, while discriminating against Black women specifically — the intersectional gap that single-axis metrics cannot see. This is the same structural blind spot that appears when Red Teaming For AI exercises fail to probe intersectional attack surfaces, and when Hallucination audits check output quality without checking distributional equity across groups.
The Data Says
Fairness metrics are not a fix. They are a diagnostic — a structured way to see what aggregate accuracy hides. The impossibility theorem guarantees that no single metric captures the full picture, which means the choice of metric is itself a value judgment wearing technical clothing. The organizations that get this right are the ones that name the trade-off before the audit, not after.
AI-assisted content, human-reviewed. Images AI-generated. Editorial Standards · Our Editors