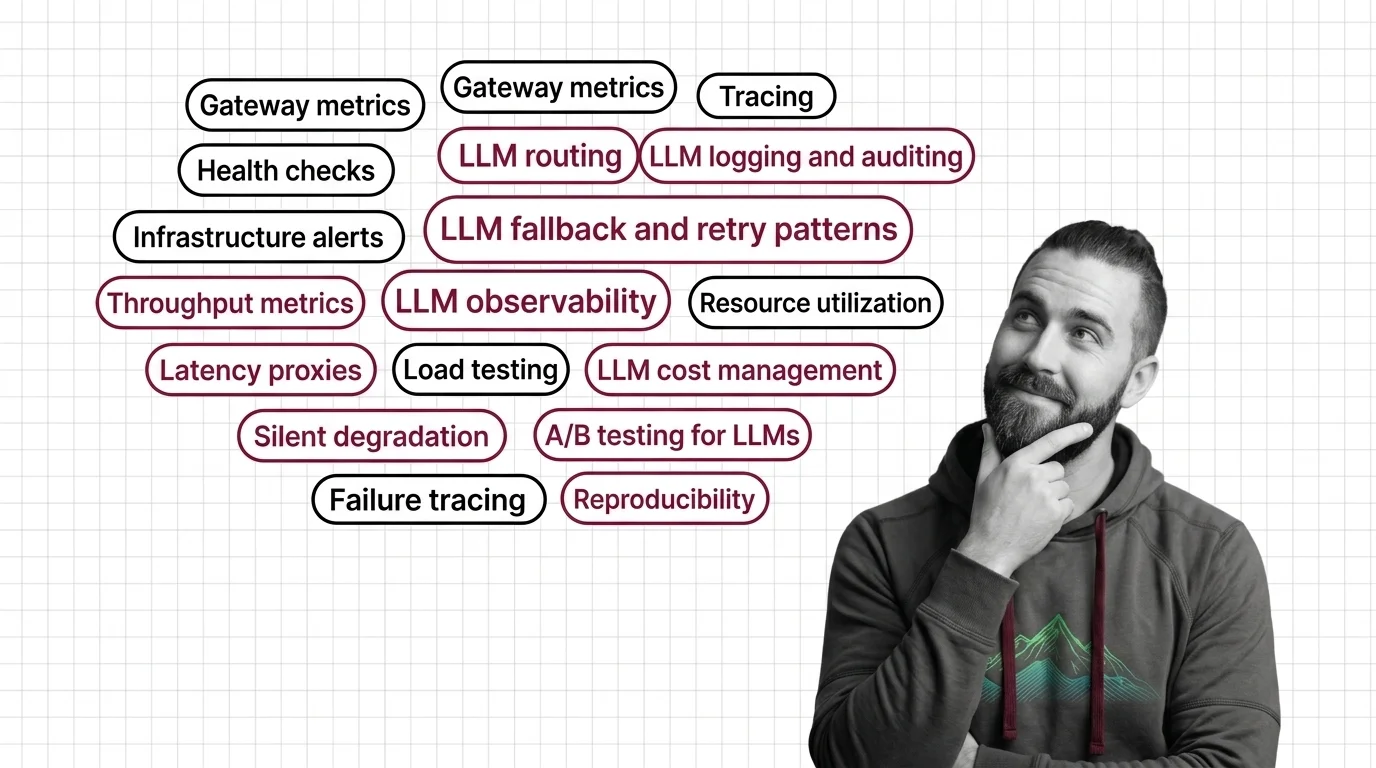
LLM observability is what makes every other layer of the LLMOps production stack debuggable — without traces, you cannot tell whether a routing change, a cost cut, or a silent provider swap actually moved the needle on quality. It is one of the theme’s two foundations, alongside the gateway that controls the traffic this topic exists to watch. The reason it earns its own page is that a model failure rarely throws an exception: the response comes back complete, well-formed, and wrong, and only structured tracing surfaces that.
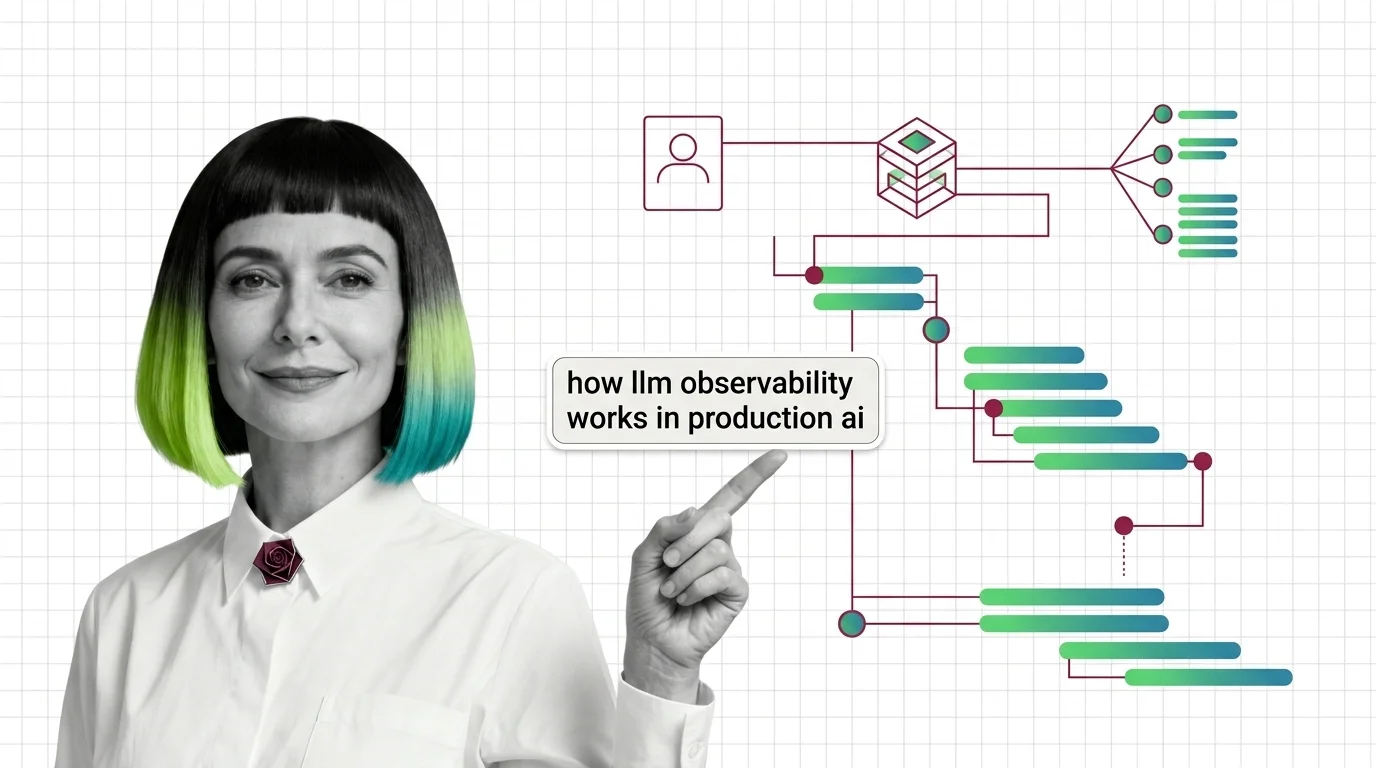
Span-based tracing captures the prompt, the response, per-hop latency, and token cost at every step of a chain, so a failure traces back to the exact step that caused it.
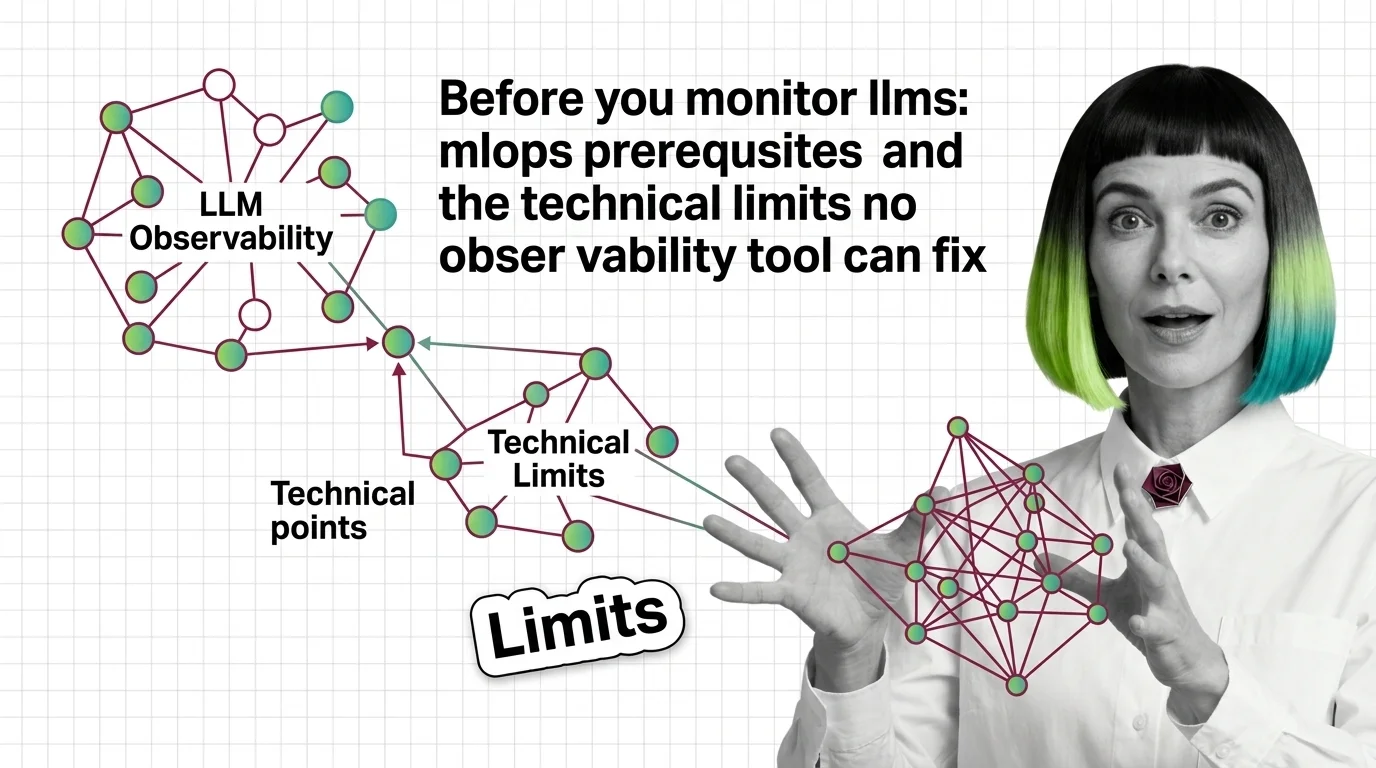
Before any tool adds value, the operational basics have to already exist — consistent logging, a working sense of normal behavior, and clear model-version tracking — or dashboards just add detail to noise you can’t interpret.
The platform market is consolidating around OpenTelemetry as a shared protocol and a handful of managed platforms as the delivery model, so a new tooling choice today should assume that convergence.
Traces contain real prompts and responses, which can include sensitive data — check what a vendor’s contract allows before adopting a platform, not just its marketing page.
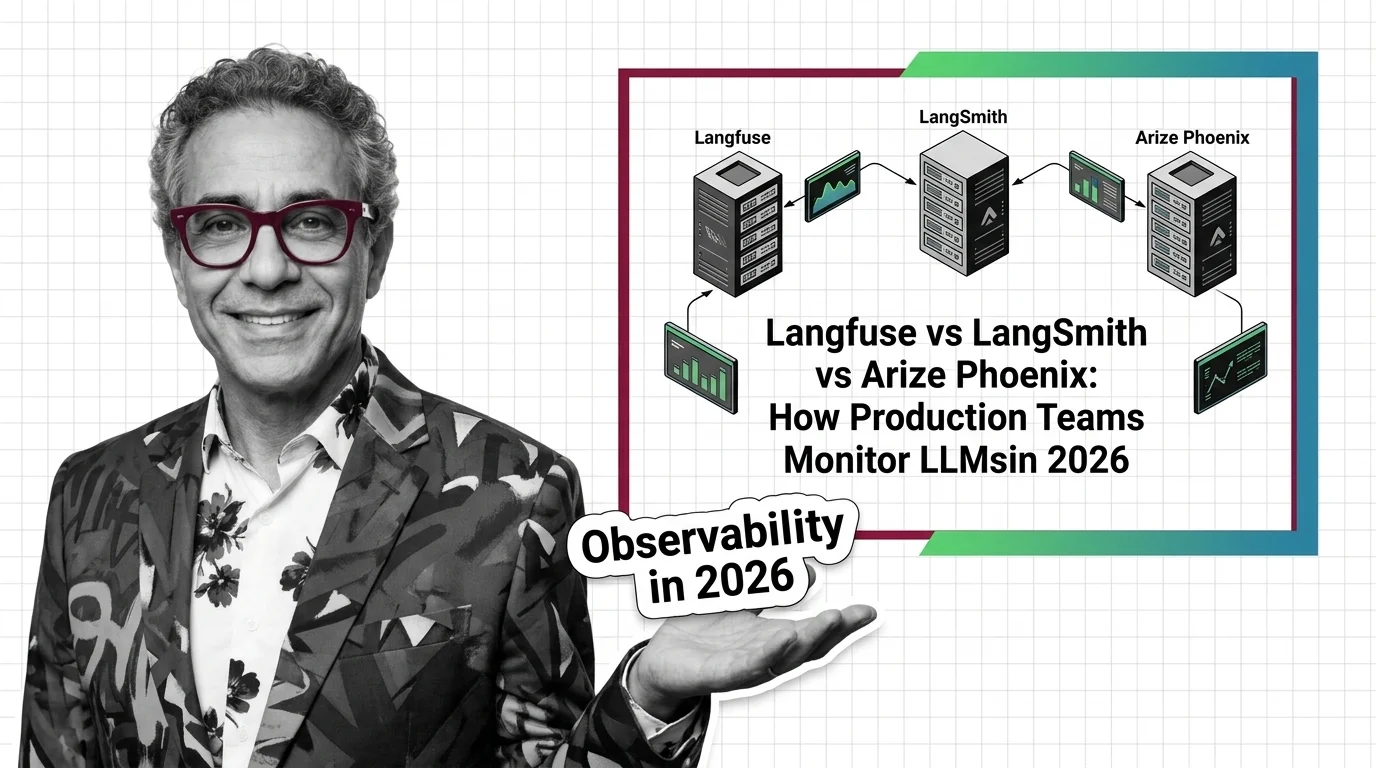
For the platform decision itself, the Langfuse vs LangSmith vs Arize Phoenix comparison tracks where the market actually consolidated in 2026. Before any of them ship, read who owns your prompts: every trace you capture is also a copy of your users’ real conversations sitting on someone else’s infrastructure, governed by a contract your users never saw.
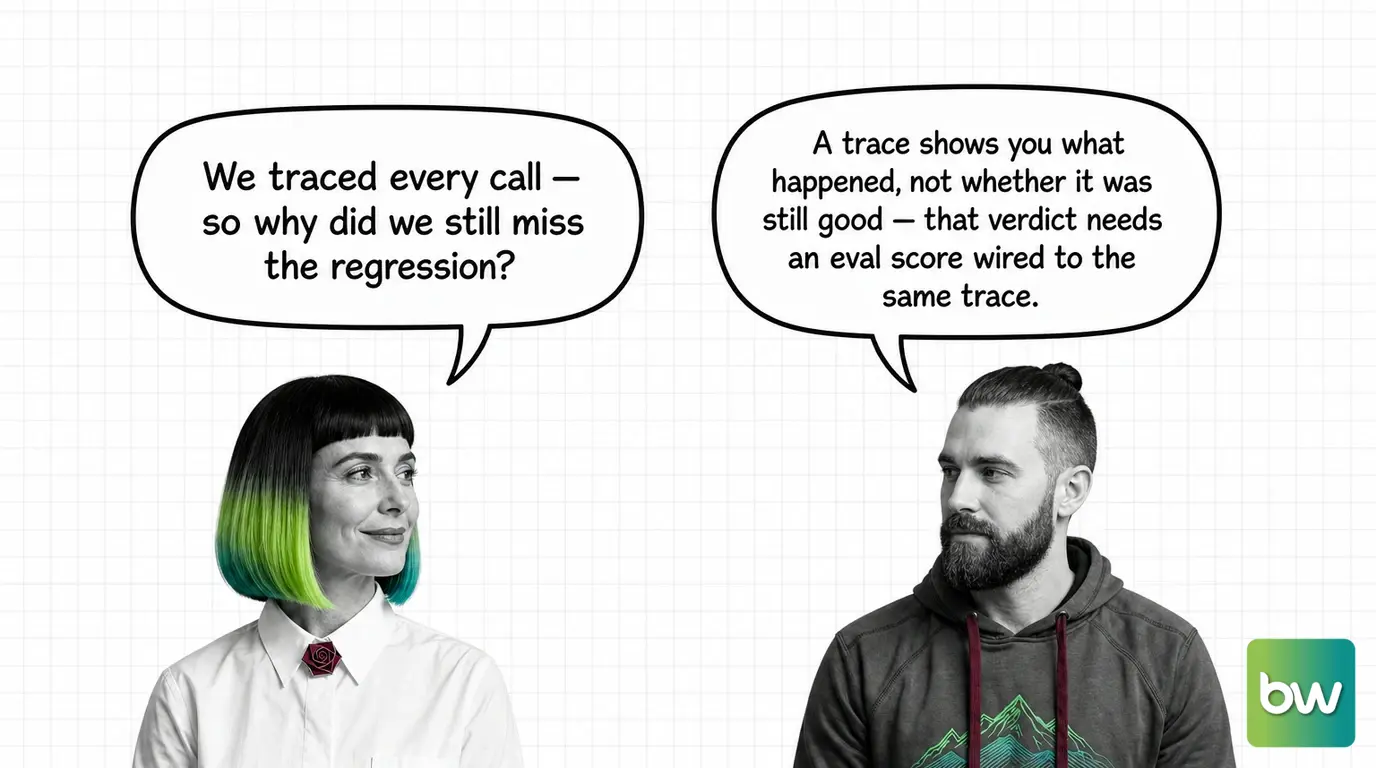
Tracing captures everything; only eval scores catch what changed.
How observability differs from classic APM and the gateway
Two neighbours get confused with this topic, for opposite reasons.
Classic APM instruments codes, not content. A conventional monitoring stack logs request duration and status codes; an LLM trace also has to carry the prompt, the response text, and the token cost, because a call that returns 200 with a confidently wrong answer is this topic’s actual failure mode — a status code never catches it.
A gateway controls; observability records. A gateway is the control point deciding where a request goes and what happens on failure; observability is the record of what already happened once it got there. A gateway with no tracing behind it can misroute silently; traces with no gateway in front just describe a system nobody is steering.
Common questions about LLM observability
Q: Langfuse or LangSmith for a new production LLM app?
A: Langfuse is MIT-licensed, self-hostable, and OpenTelemetry-native, so you keep control of the data; LangSmith trades some of that control for deep native wiring into LangChain and LangGraph. The instrumentation guide sets the trace-boundary contract either tool needs first.
Q: My application already logs errors — do I still need dedicated LLM observability?
A: Error logs catch exceptions; they miss the failure mode this topic exists for, a response that returns cleanly but is wrong. The MLOps prerequisites read covers what structured logging still needs to add before a trace is trustworthy.
Q: Why does my app look fine in the logs but still return wrong answers to users?
A: Standard logs record that a call succeeded, not whether the output was correct — that verdict lives in span-based tracing that captures the prompt, response, and each hop’s latency. Span-based tracing traces the failure back to its exact step.
Q: Do I need a separate eval pipeline once tracing is already in place?
A: Yes — tracing tells you what happened in one call; an eval pipeline scores whether the output was still good and catches regressions before users do. Regression detection and eval pipeline patterns cover the scorer and alert setup tracing alone doesn’t provide.
Q: Can my LLM observability vendor use the prompts it captures to train its own models?
A: Check the contract, not the marketing page — data-use terms vary by vendor and are typically set before your users ever see a privacy notice. Who owns your prompts walks through what to verify before adopting a platform.
LLM Observability extends classical observability to the probabilistic nature of language models, where the same prompt can produce different outputs — and silent regressions are invisible without structured tracing.
LLM observability applies distributed tracing to AI chains. Five span types (LLM, Task, Workflow, Tool, Agent) give each step a measurable, queryable identity.
LLM observability needs baselines before the first trace. No tool prevents hallucinations or non-deterministic output — only detects them after the fact.
2
Build with LLM Observability
The practical guides walk you through instrumenting a production LLM application end to end — setting up trace collection, configuring cost alerts, and building evaluation pipelines to catch prompt regressions before they reach users.
Operating an LLM in production looks like running any other service until the answers rot with the dashboard still green. Map which ops instincts transfer and where they break.
Add trace-level visibility to your LLM app with Langfuse 4.12.0 or LangSmith. SDK wiring, agent debugging, and the self-hosting decision tree in one guide.
3
What's Changing in 2026
LLM observability tooling is evolving rapidly as production teams discover that traditional APM metrics miss the things that actually break in AI systems — tracking what you measure matters as much as how you measure it.
LLM observability in 2026: ClickHouse acquired Langfuse, Traceloop merged into ServiceNow. Compare Langfuse, LangSmith, and Arize Phoenix for production monitoring.
4
Risks and Considerations
Observability platforms capture raw prompts and responses, which can include sensitive user data — before adopting any logging tool, consider data residency, PII handling policies, and who actually owns your captured prompts.