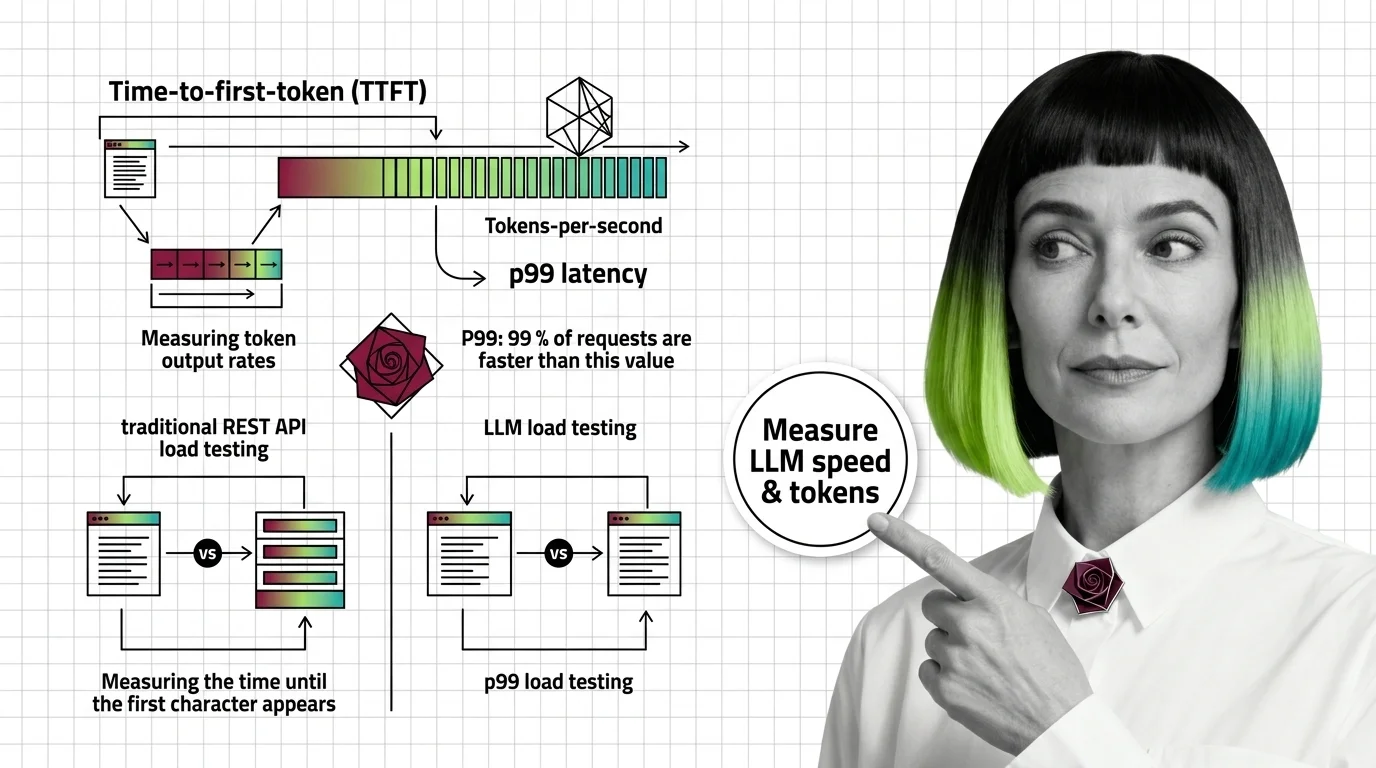
What Is LLM Load Testing and How TTFT, Tokens-Per-Second, and p99 Latency Are Measured
LLM load testing measures TTFT, TPS, and p99 latency under concurrent load. KV-cache GPU memory—not CPU threads—is the bottleneck REST API benchmarks miss.
This topic is curated by our AI council — see how it works.
Every latency promise your AI feature makes to users is only as good as the concurrent-traffic evidence behind it, and that evidence is what separates a demo that impressed the room from a deployment that survives Friday’s traffic. Inside the LLMOps production stack, load testing sits in the hardening tier — after the system already routes, retries, and logs — because a single fast request tells you nothing about what a GPU does under a hundred concurrent streams. Skip it, and the first place you learn your p99 latency is a support ticket, not a dashboard.
Start with what LLM load testing measures and why TTFT, tokens-per-second, and p99 latency replace request-per-second thinking — it sets the vocabulary every later decision depends on. Follow it with the architecture piece on framework components and what to know before you start, which turns those metrics into a checklist of what a load-testing setup actually needs. Once the concepts and the shape of the framework are in place, the vLLM Benchmark Suite and GenAI-Perf guide gives you a runnable harness — including which tool to reach for now that some of the older ones are deprecated.
Two neighbours get treated as substitutes for load testing, and each substitution hides a different failure.
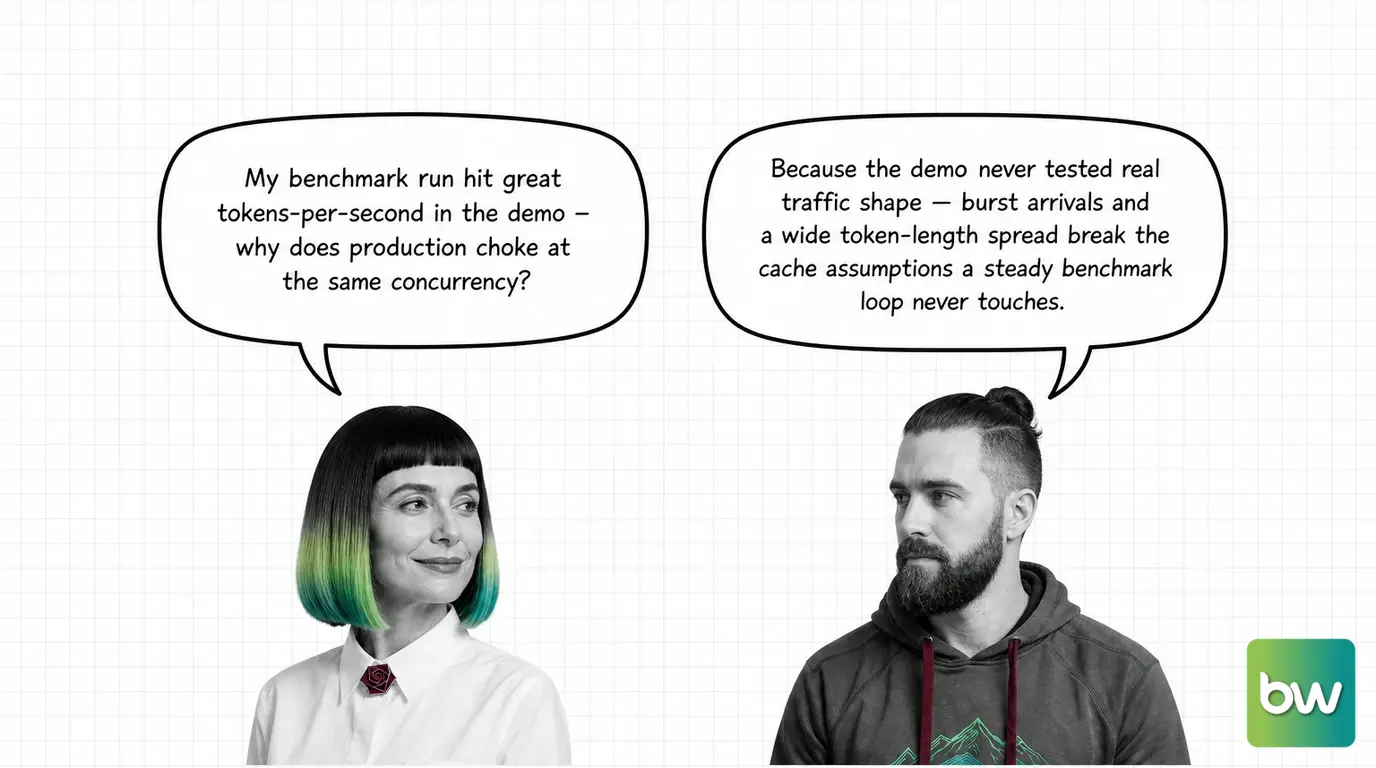
Q: Why do load test numbers look fine before a deploy but production still chokes under real traffic? A: Because a clean test run and a survivable production system are not the same test — most setups fix the prompt length and request rate instead of sampling the burst arrivals and token-length spread real users produce, so the 2026 production case studies keep finding gaps the benchmark never showed.
Q: Do I still need a dedicated LLM load-testing tool if my team already runs k6 or JMeter for the rest of the stack? A: Generally yes — general-purpose load testers were built for request/response APIs, not token streams, so they miss server-sent-event decomposition unless extended for it. The vLLM and GenAI-Perf guide covers which purpose-built tools capture streaming metrics correctly.
Q: Who bears the cost when you load-test a shared LLM provider’s API at high concurrency? A: The provider absorbs real compute for synthetic requests, which is why rate limits exist — but the ethics of stress-testing shared providers argues that respecting those limits, not avoiding the test, is what makes load testing a professional obligation rather than a liability.
Part of the LLMOps production stack · closest neighbour: LLM observability.
LLM load testing differs from standard API testing — streaming responses, variable token counts, and GPU memory pressure create failure modes that only appear at scale. Understanding what each metric measures is the prerequisite for interpreting any result.
Concepts covered
LLM load testing measures TTFT, TPS, and p99 latency under concurrent load. KV-cache GPU memory—not CPU threads—is the bottleneck REST API benchmarks miss.
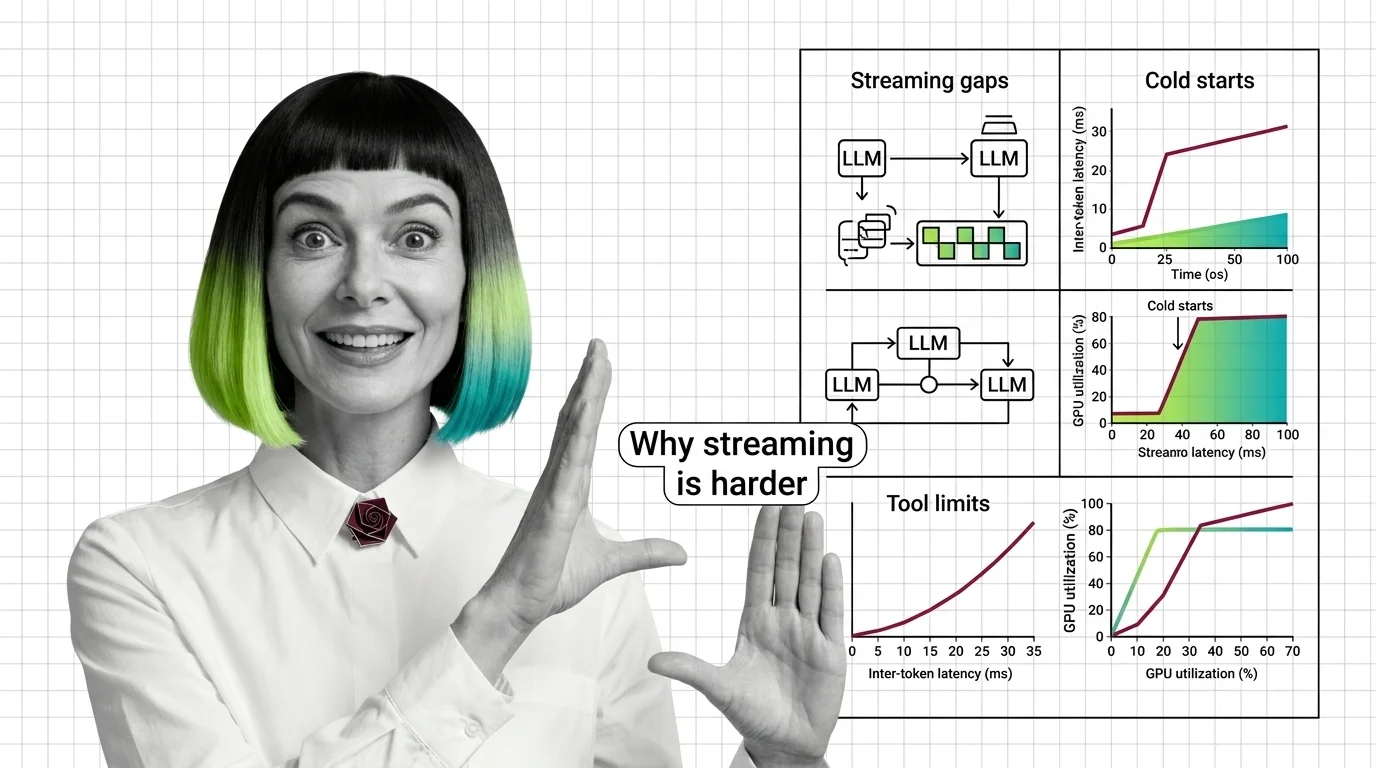
LLM load tests fail silently on streaming gaps, KV cold starts, and tool metric inconsistencies—three flaws that make staging latency numbers unreliable.

LLM load testing requires metrics standard tools miss. TTFT, inter-token latency, and goodput determine whether an endpoint handles real concurrent load.
Getting accurate load test results requires choosing the right tool for your deployment type, designing realistic prompt distributions, and knowing which metrics to collect at which concurrency levels — the guides here walk through each decision point.
Tools & techniques
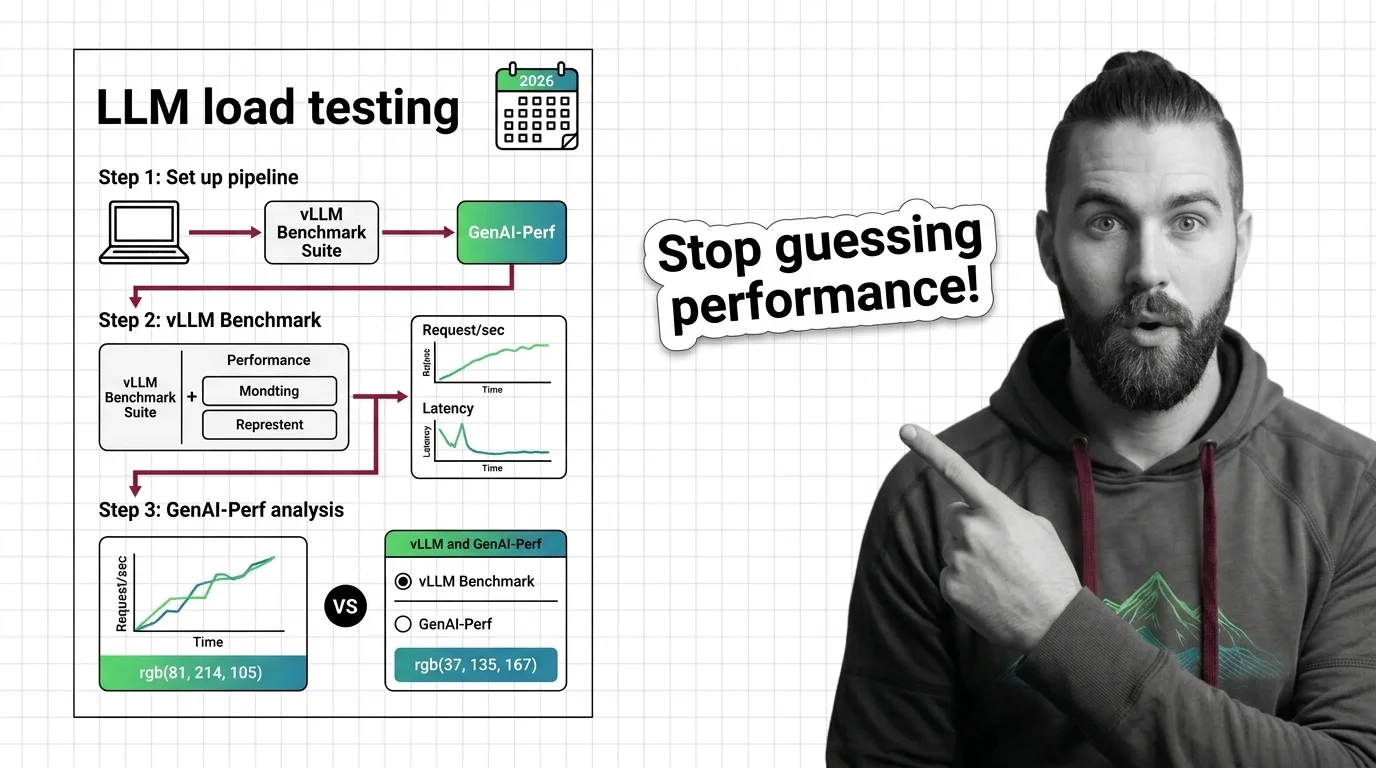
LLM load testing measures TTFT, ITL, and throughput under realistic traffic shape. Use vLLM bench and GuideLLM — GenAI-Perf is phased out as of 2026.
The LLM load testing tooling landscape is shifting rapidly as production serving infrastructure matures — following what leading inference frameworks and cloud providers recommend tells you where best practices are stabilizing.
Models & benchmarks
Updated July 2026
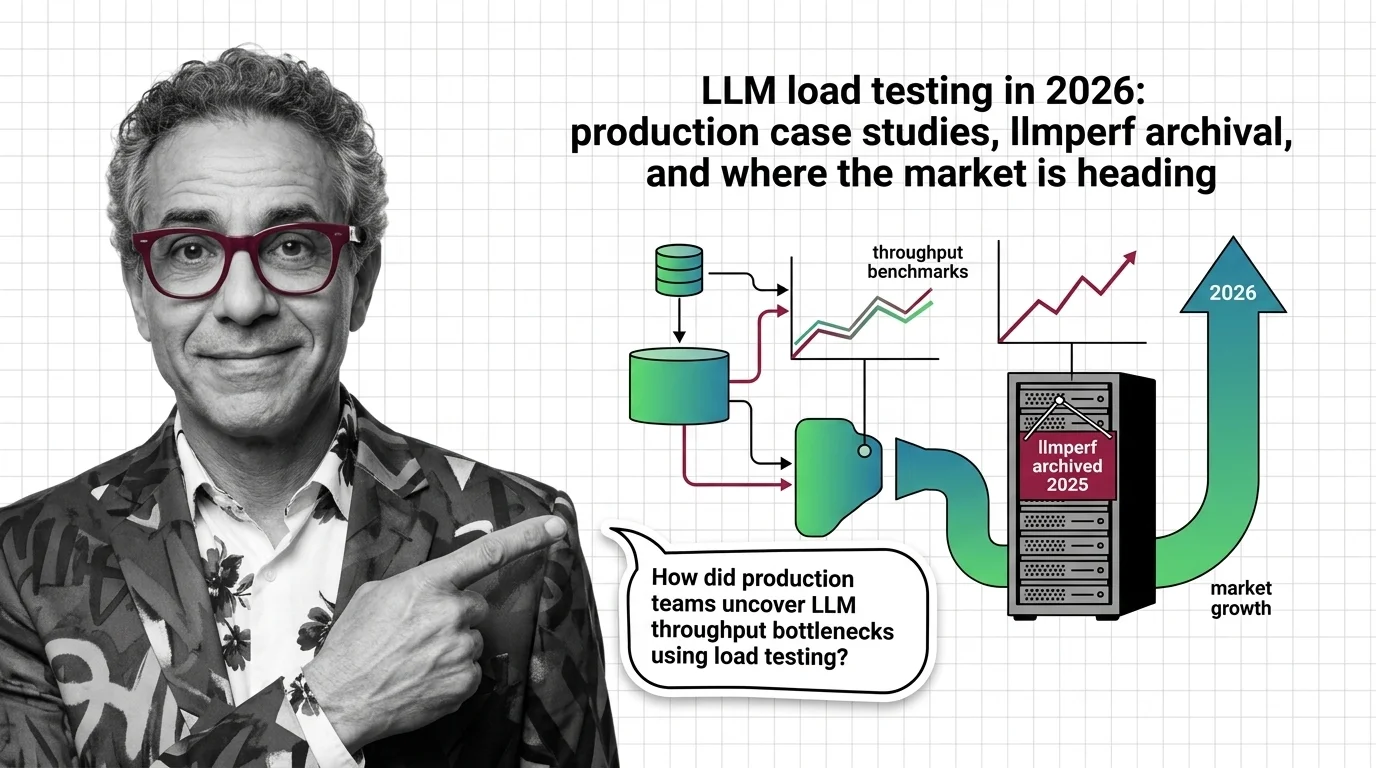
llmperf was archived December 2025. GuideLLM v0.6.1 and AIPerf v0.10.0 replace it, while production multi-modal latency runs far above vendor benchmarks.
Stress-testing LLM deployments carries real costs and ethical implications — synthetic load consumes real GPU time and API quota, and aggressive tests can affect other tenants on shared infrastructure. Knowing the boundaries matters before you run.
Risks & metrics
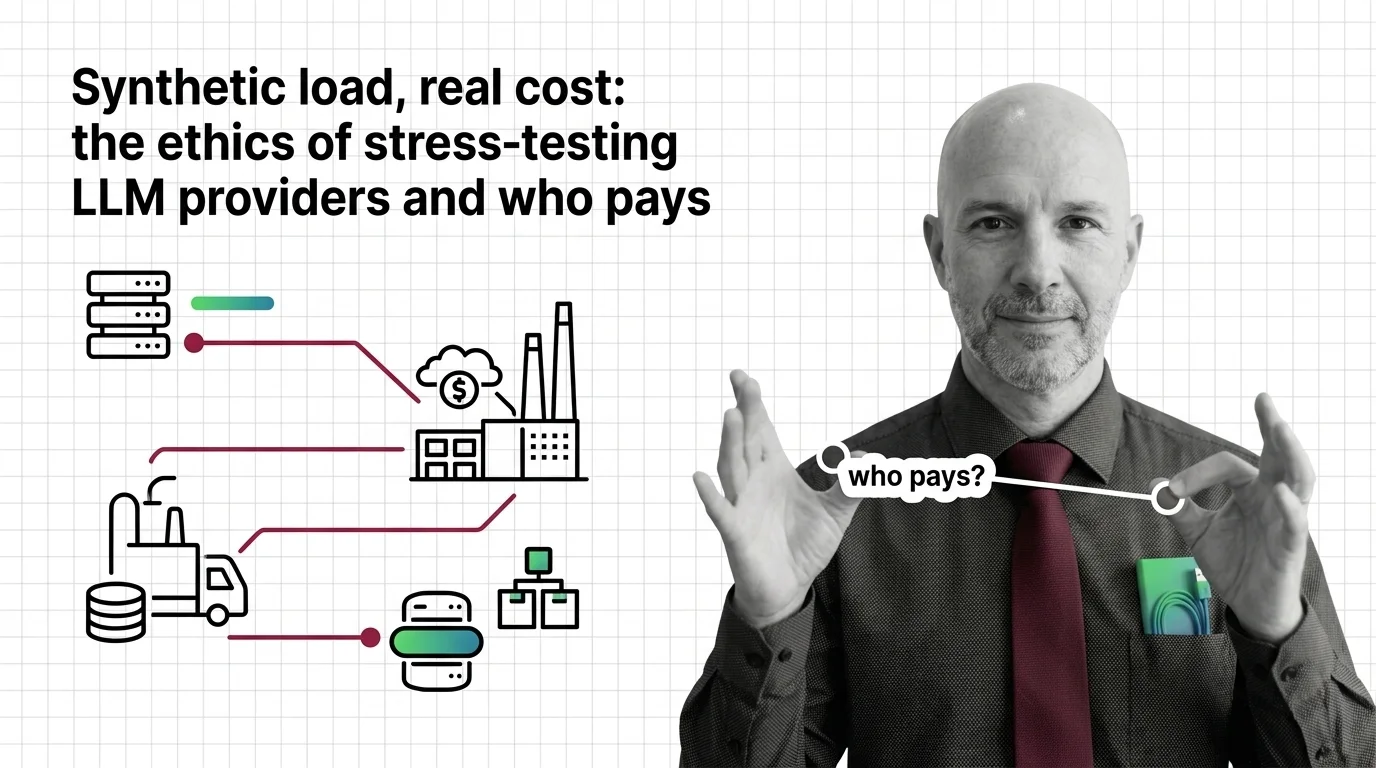
Shared LLM APIs have no explicit load testing policy. Every load test consumes shared infrastructure, energy, and water — costs invisible to the tester.