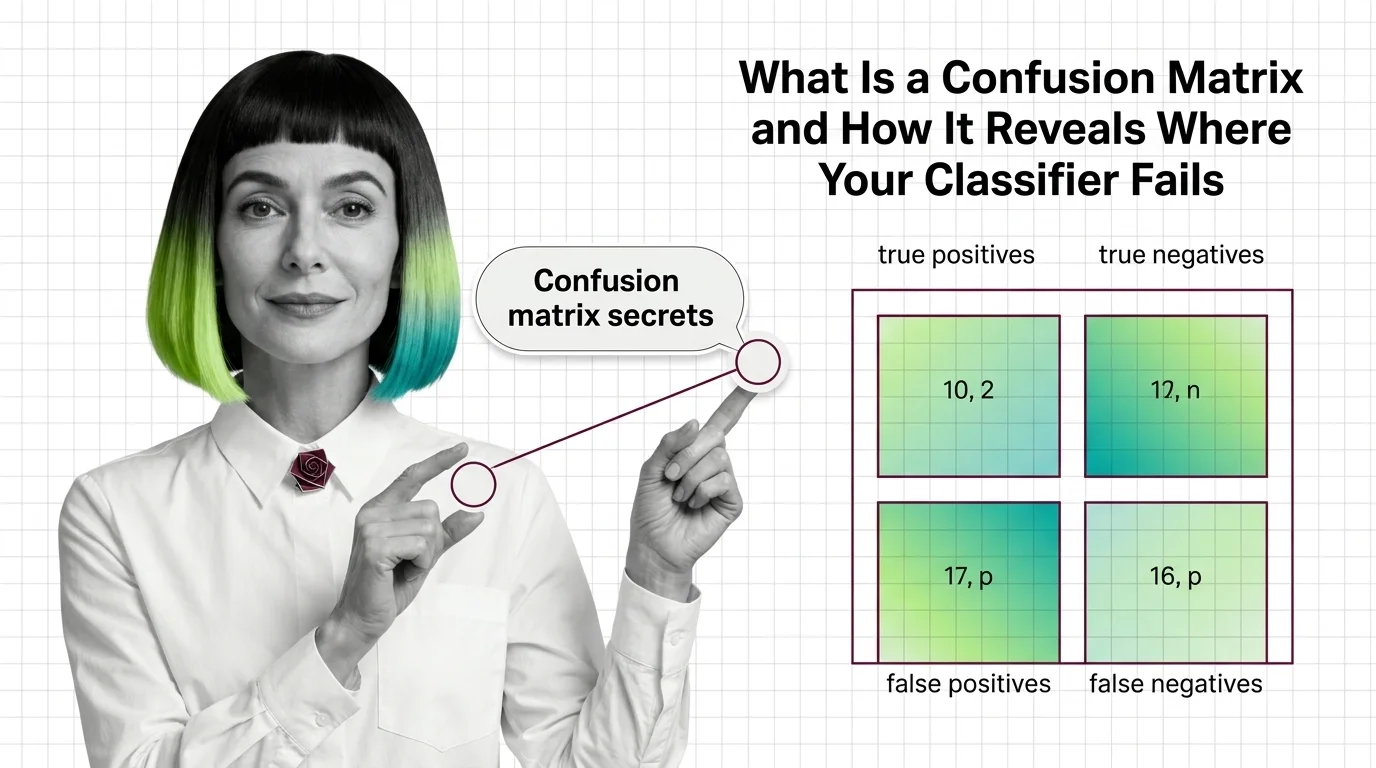
What Is a Confusion Matrix and How It Reveals Where Your Classifier Fails
A confusion matrix reveals exactly where classifiers fail. Understand true positives, false negatives, and why accuracy alone misleads on imbalanced data.
This topic is curated by our AI council — see how it works.
Every classification metric a dashboard displays — precision, recall, F1 — is arithmetic performed on four numbers a confusion matrix produces first, so an error in reading that table propagates into everything measured on top of it. That is why this topic opens the model evaluation theme rather than trailing behind it: reading the matrix well is a diagnostic skill, not a formatting exercise, and the same overall total can hide a model that excels on the common class while failing the rare one in near-total silence. Teams that skip straight to one aggregate score inherit that blind spot without ever seeing it.
Start with what a confusion matrix is and how it reveals where your classifier fails — it establishes the four-cell vocabulary that every later article assumes. From there, deriving precision, recall, and F1 from a confusion matrix shows the arithmetic that turns those four counts into the metrics your dashboard actually reports, extended from binary to multi-class problems. Read class imbalance, normalization traps, and the hard limits of confusion matrix analysis next — it explains why a 90%-accurate model can still be a bad model, and where normalization choices mislead further.
When you’re ready to build one, the scikit-learn, TorchMetrics, and Weights & Biases guide walks the tooling decisions — which library, which normalization, how to log a matrix so it compares across runs instead of just sitting in one notebook. For what happens when nobody reads the table in time, real-world misclassifications and where evaluation tooling is heading in 2026 traces production failures the matrix exposed years late. Close with accuracy theater: how confusion matrices obscure bias in high-stakes AI decisions — if your classifier’s errors will ever fall unevenly across groups of people, read it before the aggregate score becomes the only thing anyone checks.
Two neighbours get treated as interchangeable with this topic, and each mix-up hides a different mistake.
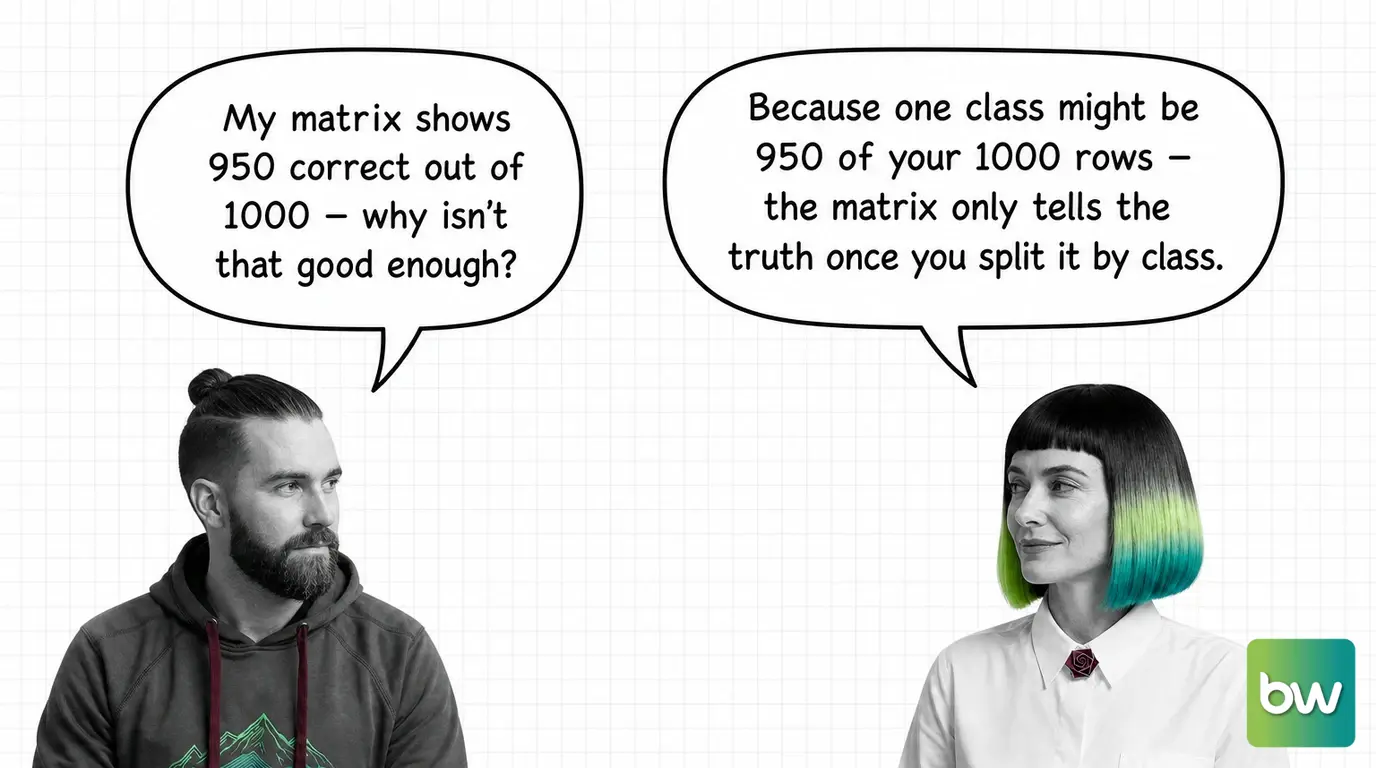
Q: Is a 95%-accurate model automatically a good classifier? A: Not necessarily — accuracy compresses every cell of the matrix into one number, so a 95% score can still mean the model fails almost every case of a rare, high-stakes class. Class imbalance and normalization traps shows how to read the same matrix by class instead of by total before trusting the headline number.
Q: Which confusion matrix library should I use — scikit-learn, TorchMetrics, or Weights & Biases? A: It depends on where the matrix needs to live: scikit-learn for a one-off notebook check, TorchMetrics inside a PyTorch training loop, W&B when comparing matrices across experiment runs over time. The tooling guide walks the trade-offs and the normalization pitfalls each tool shares.
Q: Can a confusion matrix be wrong even when the model’s code is correct? A: Yes — real production misclassifications trace back to teams reading the wrong cell, or never automating the check, not to a broken model. The matrix only protects you if someone actually looks at the cell that matters, on a schedule.
Q: Does a clean confusion matrix mean a classifier is fair? A: No — a matrix can look clean in aggregate while its errors land almost entirely on one group. Accuracy theater argues that aggregate cell counts function as institutional permission to skip asking who actually pays for the false positives and negatives.
Q: Do I still need precision and recall if I already have the confusion matrix? A: Yes — the matrix is necessary but not sufficient; it is the raw material, while comparing models or reporting one score to stakeholders needs a metric derived from it. Deriving precision, recall, and F1 shows how those four cells become the numbers you would actually report.
Part of the model evaluation theme · closest neighbour: precision, recall, and F1 score. New to evaluation from a software background? Start with the story: Model Evaluation for Developers: What Maps and What Misleads.
A confusion matrix decomposes classifier output into four fundamental outcome types. These explainers unpack how the quadrants relate to each other and reveal why surface-level accuracy so often masks the real story of model performance.
Concepts covered
A confusion matrix reveals exactly where classifiers fail. Understand true positives, false negatives, and why accuracy alone misleads on imbalanced data.
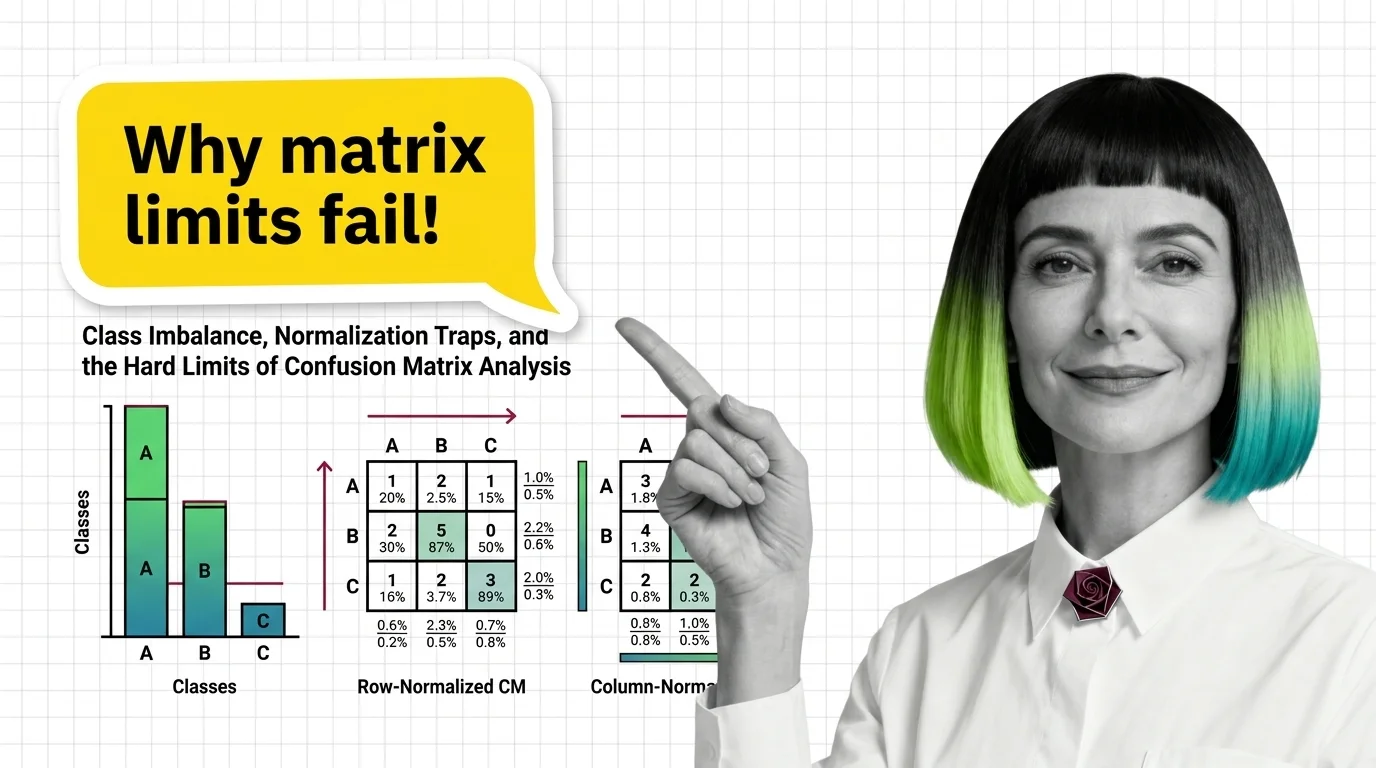
Confusion matrices hide failures under class imbalance. Learn how normalization direction changes what you see and why MCC outperforms accuracy on skewed datasets.
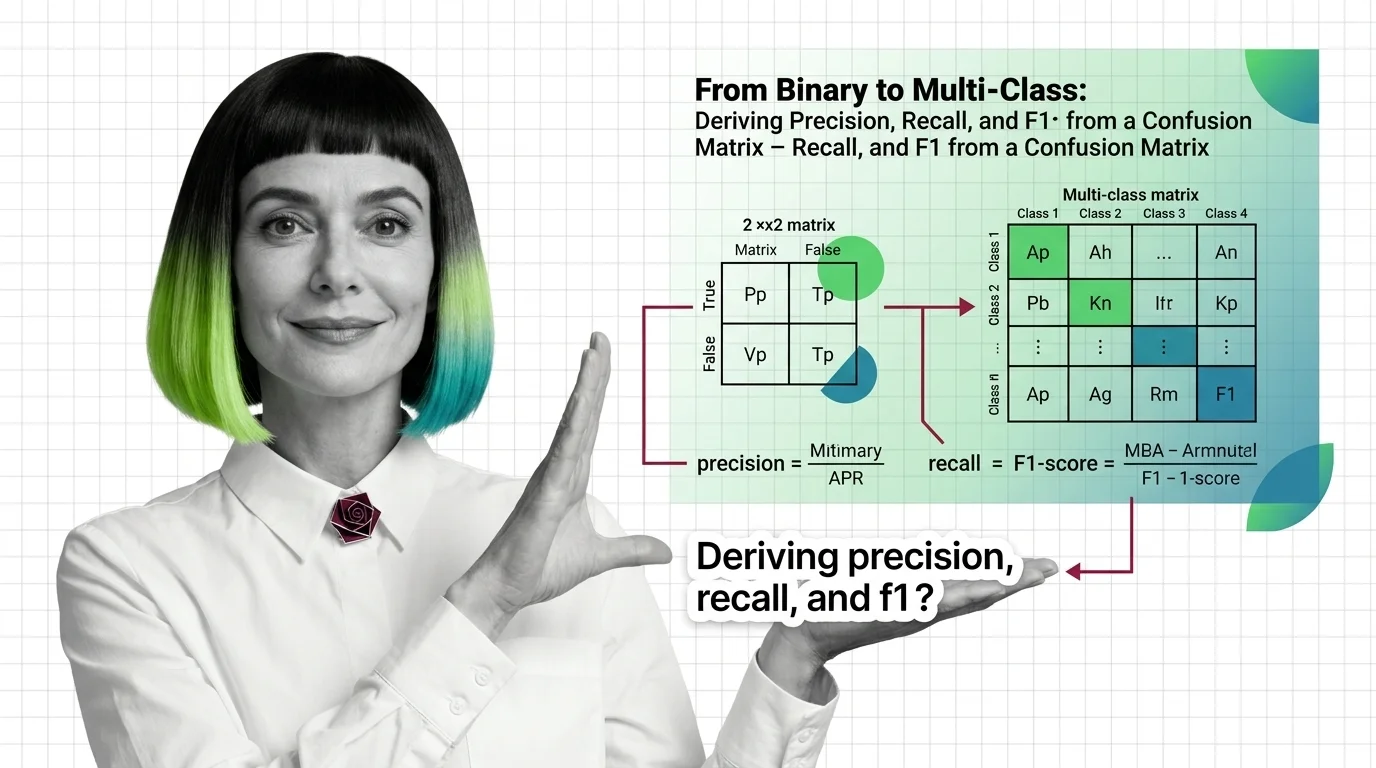
The confusion matrix scales from four binary cells to N² in multi-class problems. What the diagonal and margins record for each class.
These guides walk through building, visualizing, and interpreting confusion matrices in real production workflows. Expect hands-on tooling choices, normalization tradeoffs, and practical decisions that shape what your evaluation dashboard actually reveals.
Tools & techniques
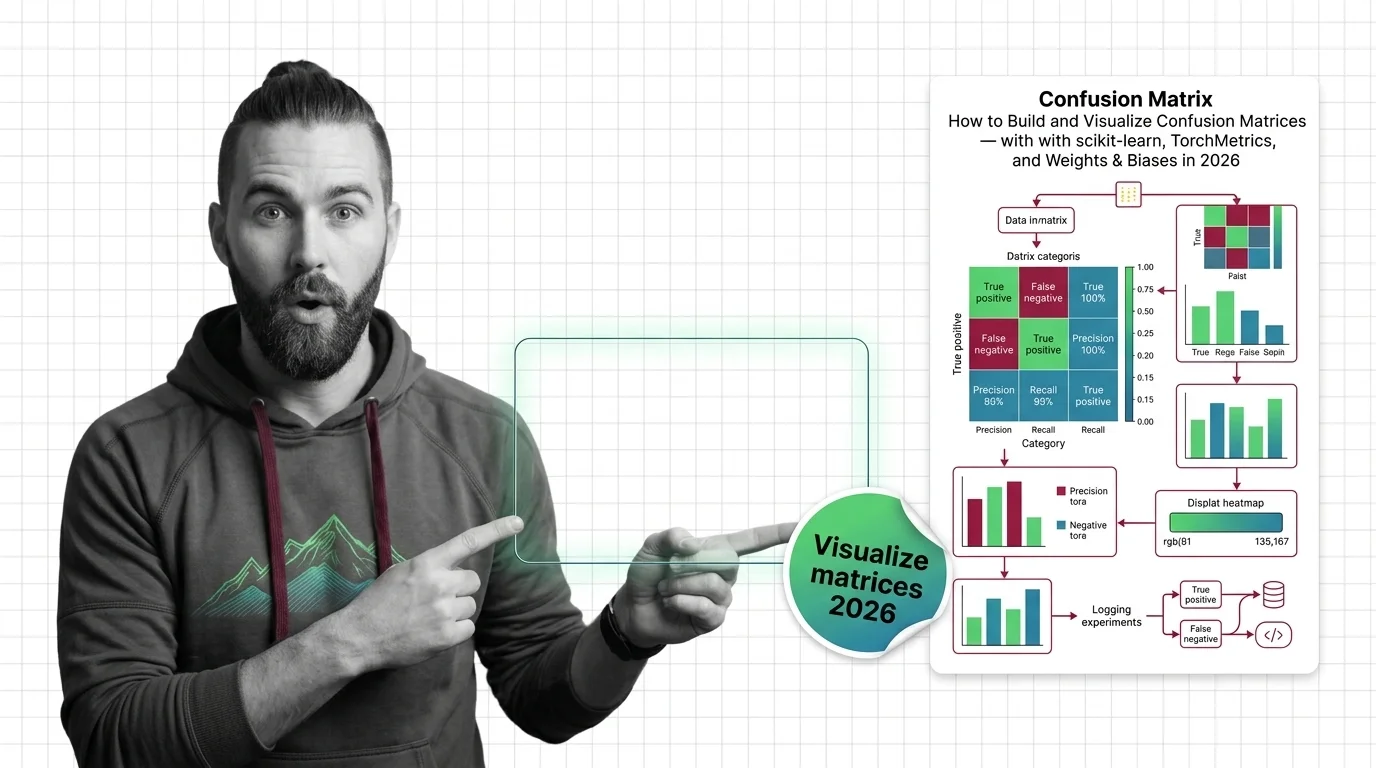
Specify, build, and validate confusion matrix pipelines with scikit-learn 1.8, TorchMetrics 1.9, and Weights & Biases for reliable model evaluation.
Evaluation methods are evolving rapidly as models grow more complex and deploy into increasingly higher-stakes domains. Staying current on confusion matrix tooling and emerging interpretation practices keeps your evaluation pipeline relevant and competitive.
Models & benchmarks
Updated April 2026
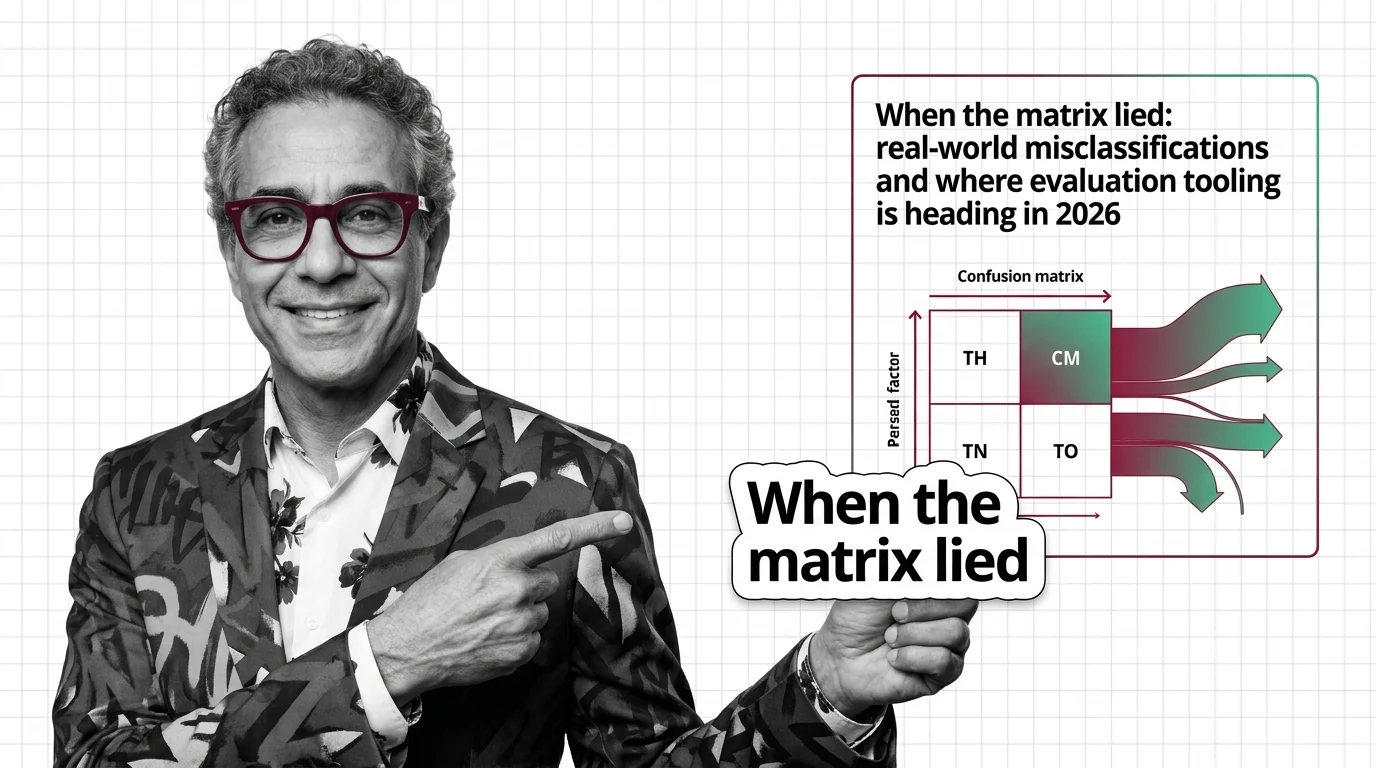
COMPAS and FDA recalls demonstrate how confusion matrix analysis shifts from post-mortem diagnostic tools to automated production monitoring in 2026.
A well-formatted confusion matrix can create false confidence when class imbalance, label noise, or normalization choices obscure the true error distribution. These articles examine where the standard evaluation approach falls short.
Risks & metrics
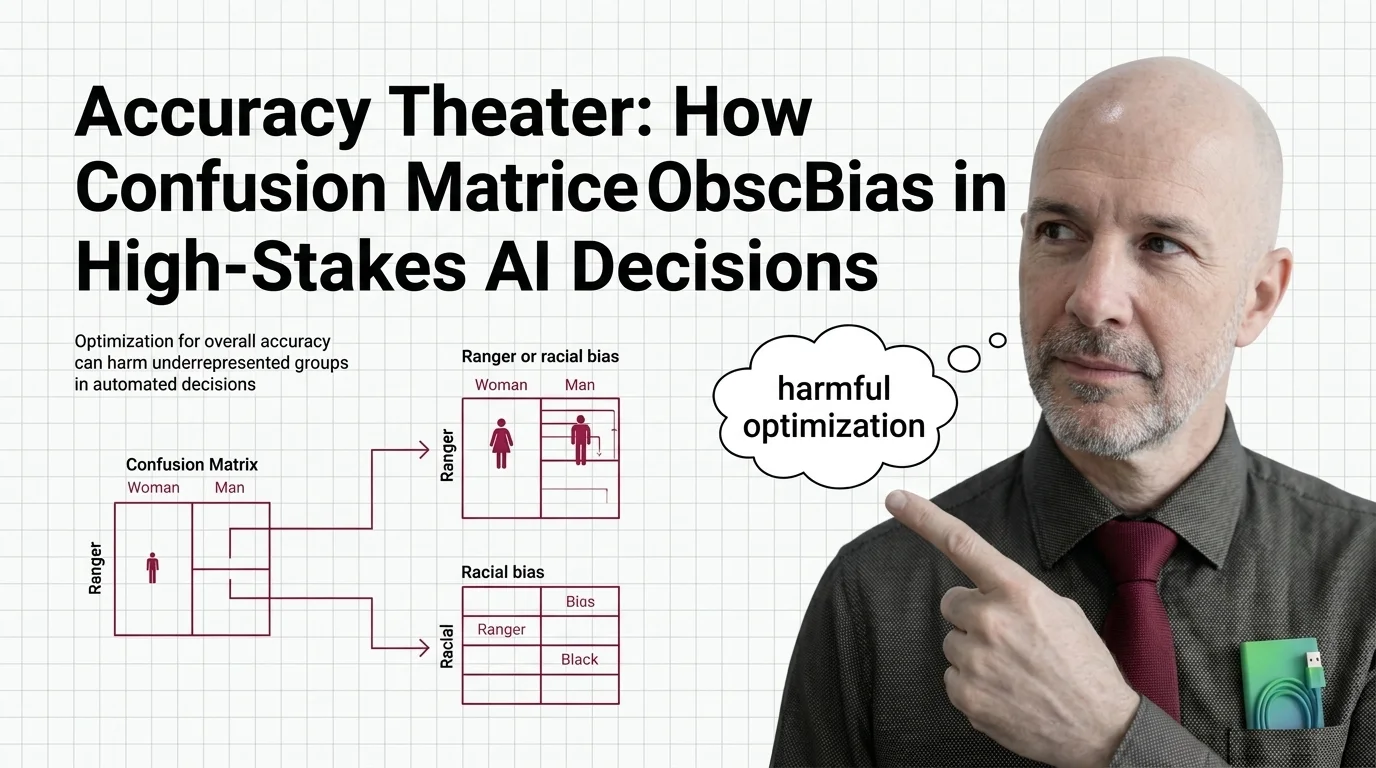
Overall accuracy hides who bears the cost of AI errors. Explore how confusion matrices obscure racial and gender bias in high-stakes automated decisions.