Streaming Gaps, Cold Starts, and Tool Limits: The Hard Technical Constraints of LLM Load Testing
ELI5
** LLM Load Testing** isn’t just slower REST testing. LLMs stream tokens incrementally, creating two distinct latency events — first-token delay and mid-stream stutter — that standard tools miss entirely, measuring only the finish line.
A controlled experiment isolated KV cache state as the only variable between two identical workloads and found staging p50 at 400 milliseconds versus production p50 at 1.8 seconds for the same endpoint, per TianPan.co Blog. Nothing in the load test surfaced this gap. The tool returned numbers that were technically correct, methodologically sound, and structurally misleading.
Not a tuning problem. A category error.
The engineers who designed REST benchmarking tools built them around a clean event sequence: send request, start timer, receive response, stop timer. One interesting boundary. LLMs broke this assumption at the protocol layer before most teams had time to notice.
A Stream Is Not a Response
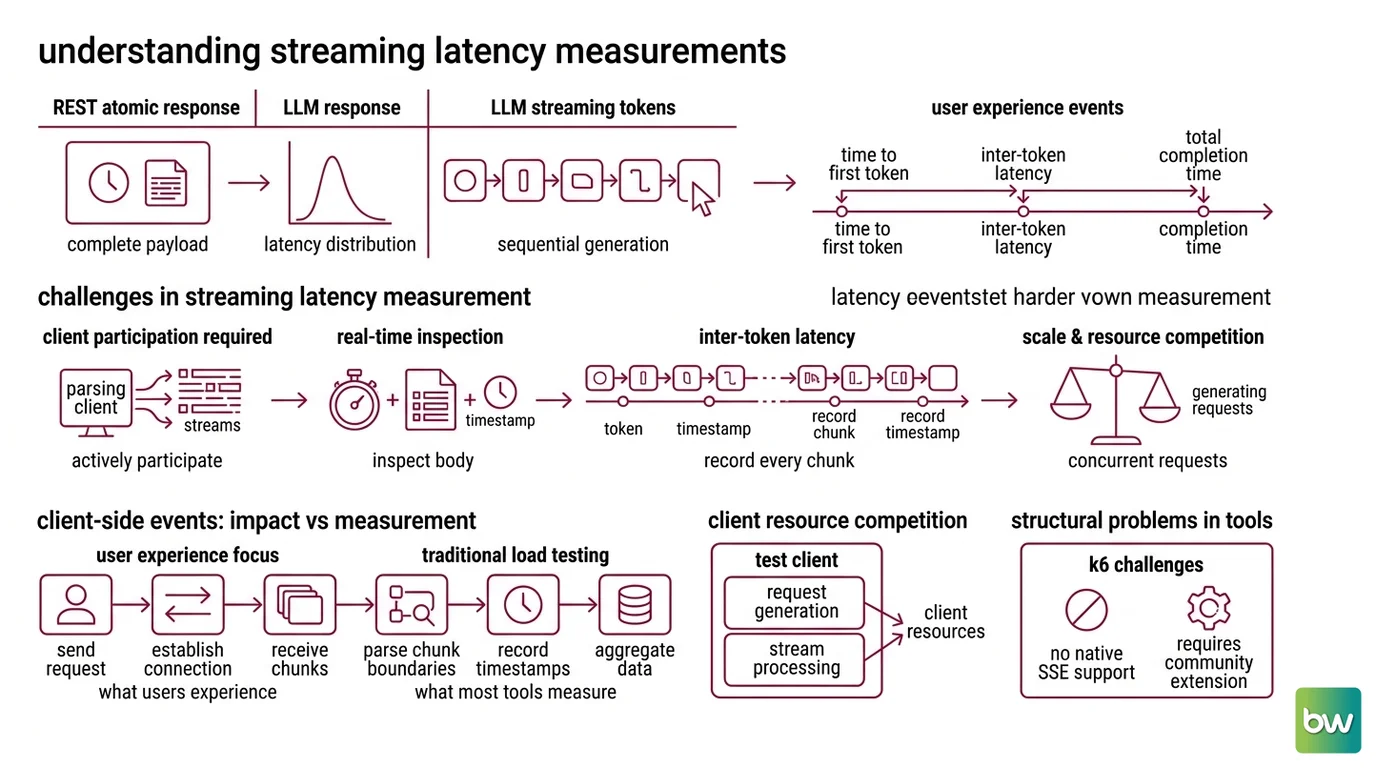
A REST endpoint responds atomically — the client waits, then receives a complete payload. The latency distribution for a REST API is a distribution over a single boundary event.
An LLM generates tokens sequentially and streams them as they are produced. The client receives a series of partial chunks over an open connection until the completion signal appears. This creates at least three distinct latency events that matter to the user experience: time to first token (how long until the cursor starts moving), Inter Token Latency (the rhythm of the stream), and total completion time — the finish line most tools were built to measure.
Most load testing configurations measure only the third event. The first two are what the user experiences.
Why is measuring streaming latency in LLMs harder than measuring REST API latency?
The core problem is that streaming responses require the client to actively participate in measurement. For a REST endpoint, timing is passive: record start and stop timestamps around a blocking call. For a streaming endpoint, the client must inspect the response body in real time, parse chunk boundaries, and record a timestamp at the exact moment the first meaningful token arrives — before the response has finished.
Inter-token latency demands a timestamp for every chunk, not just the first and last. Above 100 milliseconds between tokens, the stutter becomes visible to users; above 50 milliseconds, it becomes noticeable to attentive ones, per TianPan.co Blog. Capturing this at scale means the test client must perform non-trivial parsing under load, at precisely the moment it is also generating concurrent requests — the two tasks compete for the same resources.
This is where standard HTTP load testing tools run into structural problems. k6 has no native support for Server-Sent Events (the protocol underlying most streaming LLM endpoints) and requires a community extension just to handle streaming responses at all. Even with the extension, TTFT and inter-token latency instrumentation remain manual — the core tool provides no native LLM-aware parsing (TianPan.co Blog). A default k6 test against an LLM endpoint therefore measures total response time — a number that conflates generation quality, server-side prefill duration, and decode speed into a single value that predicts none of them individually.
The thresholds that define acceptable user experience are tight enough that this conflation matters. A coding copilot requires TTFT below 200 milliseconds (TianPan.co Blog) — a threshold strict enough that a benchmark without TTFT instrumentation cannot tell you whether the system meets it.
Synchronous tools measure the wrong event — and the wrong event correlates loosely with the right one under ideal conditions, making the error invisible until production conditions diverge from test conditions.
Why the Staging Number Is Always Optimistic
The second structural problem operates at a different layer. It doesn’t affect what the tool measures — it affects what the system produces during the test, compared to what it produces under real production load.
The KV Cache stores intermediate attention computations for tokens already processed by the model. When a request arrives with a prefix the model recently processed — a shared system prompt, a repeated context block, a common preamble — the model skips recomputing attention over those tokens entirely. When the cache is cold, the model computes from scratch.
Staging is structurally warm; production starts cold.
How do KV cache warming and cold starts distort LLM load test results?
In a load test, requests arrive in a controlled burst against a system that has already been warmed by prior test traffic. Shared prefixes accumulate in cache. The test environment runs with elevated cache hit rates that do not reflect the distribution of cache states in real user traffic — because real user sessions start fresh, context lengths vary, and system prompt combinations rotate.
The magnitude of the distortion is substantial. For a 100,000-token prompt, the difference between cold and warm cache is 11.5 seconds versus 2.4 seconds — roughly 80% faster when warm, per measurements in TianPan.co Blog. For shorter prompts, the improvement ranges from 7% to 67% depending on prefix length and repetition density. What looks like a 400-millisecond p50 in staging becomes a 1.8-second p50 under real production conditions with meaningful cold-start exposure.
The compounding effect is particularly relevant for agentic workflows. In a 10-step chain — where each step has its own system prompt and accumulating context — if each call has a 30% probability of hitting a cold cache, the probability that at least one call encounters cold conditions exceeds 97% (TianPan.co Blog). The LLM Fallback And Retry Patterns that look straightforward in isolation become entangled with cache state: a timeout triggered by apparent slowness may itself arrive into cold-cache conditions, compounding the delay rather than escaping it.
The test environment optimizes for reproducibility. Reproducibility is exactly what makes it wrong.
The Tool That Disagrees with the Other Tool
Even when engineers instrument TTFT correctly and deliberately introduce cold-cache conditions into their tests, a third structural problem surfaces at the comparison layer: numbers from different tools are not comparable, because the tools do not agree on what they are measuring.
NVIDIA NIM Benchmarking documentation states directly that client-side tools are not consistent in how they define, measure, and calculate metrics. Two tools running against the same endpoint may report different P99 Latency values — not because either tool has a bug, but because they disagree on whether p99 includes connection setup time, how they handle chunk boundaries in the latency calculation, or which partial responses count toward the distribution. The same inconsistency applies to Tokens Per Second: tools define and calculate throughput differently, making cross-tool comparisons unreliable even for identical workloads.
No two tools agree on what they measure.
What are the technical limitations of open-source LLM load testing tools in 2026?
Each dominant tool carries specific measurement constraints worth understanding before choosing one for production evaluation.
k6 treats LLM endpoints as HTTP endpoints. Without the community SSE extension, it cannot measure TTFT or inter-token latency — only full response time. Even with the extension, TTFT instrumentation is manual. k6 is strong at generating high Request Concurrency, but lacks native LLM-aware metric collection; post-processing is required to extract meaningful signal from streaming responses.
Locust faces a different structural constraint: the Python GIL. At high concurrency, the GIL forces tokenization parsing to compete with request generation for CPU time. This inflates inter-token latency measurements — the tool perceives latency between tokens that is partly measurement overhead, not actual inter-token delay. Locust supports distributed mode via a master-worker architecture, which partially mitigates this, but the GIL problem at the token-measurement level is inherent to the runtime.
Gatling has native SSE support built into its core. Built on the JVM with async I/O, it sustains thousands of concurrent SSE connections without the single-threaded measurement interference that affects Locust. For streaming LLM endpoint testing, Gatling is the most capable of the general-purpose tools, though extracting LLM-specific metrics still requires configuration and post-processing.
LLMPerf (ray-project/llmperf) is purpose-built for LLM evaluation and supports variable token distributions via --mean-input-tokens and --stddev-input-tokens, which enables more realistic traffic shapes than fixed-prompt tests. It runs single-machine by default and requires Ray setup for distributed operation. Its active development status for 2026 has not been confirmed from public sources.
NVIDIA AIPerf v0.10.0 (released June 9, 2026) measures TTFT, inter-token latency, tokens per second, and requests per second across p50/p90/p99 percentiles, using a multiprocess architecture via ZMQ for scalable concurrency (AIPerf GitHub). It supports any OpenAI-compatible endpoint, including NIM, Ollama, and HuggingFace TGI. Two documented limitations: port exhaustion above 15,000 concurrent connections, and invalid configuration can trigger infinite hangs requiring manual termination. AIPerf replaced GenAI-Perf, which NVIDIA has deprecated with no further feature development — existing users should migrate (NVIDIA Triton Docs).
Compatibility note:
- GenAI-Perf: Deprecated as of June 2026 — NVIDIA is no longer developing new features. Official migration guide available via NVIDIA Triton Docs. Use AIPerf v0.10.0 (
pip install aiperffrom theai-dynamoorg) instead.
What These Numbers Actually Predict
The three structural gaps — streaming instrumentation, cache state, and tool metric inconsistency — compound in a specific direction: each one makes the system look better than it is under real user load.
A benchmark that conflates TTFT with total response time will report more consistent numbers, because total completion time is larger and smoother. A staging benchmark running against a warm KV cache will report lower latency than production cold-start conditions. A p99 number calculated with different boundary assumptions will produce the value that best matches whichever tool the developer selected first.
If you instrument TTFT explicitly, you will find that its distribution is often more variable than total latency. Small changes in LLM Gateway routing decisions, Model Routing logic, or upstream Rate Limiting affect the prefill phase disproportionately, because prefill cannot be parallelized across tokens the way decode can. Total latency absorbs this variance; TTFT exposes it.
If you introduce deliberate cold-cache conditions into load tests — randomizing prompts, rotating system prompts, varying prefix lengths — p50 numbers will increase, and tail latency will extend substantially. The gap between that number and the staging p50 is the actual reliability signal: it describes how much of your staging performance was an artifact of cache state rather than genuine system capacity.
If you compare results across two tools without first verifying that they share a metric definition, the comparison is not a measurement — it is an artifact of methodology.
When it breaks: Load testing fails as a reliability signal when staging cache warming state diverges from production and when TTFT is not instrumented as a first-class metric. Both are common defaults; both produce benchmark results that describe a system with systematically better performance characteristics than the one users will experience.
The Data Says
The measurement problem in LLM load testing is structural: streaming endpoints require active client-side instrumentation to capture TTFT and inter-token latency, KV cache warming in staging produces optimistic latency distributions that do not reflect production cold-start exposure, and no two open-source tools agree on the precise calculation of any given metric. Until load tests are designed to account for all three axes, the numbers they produce are internally consistent but externally unreliable — valid within the test environment, misleading as a prediction of user experience.
AI-assisted content, human-reviewed. Images AI-generated. Editorial Standards · Our Editors