Prompt Regression Detection, Cost Alerts, and Eval Pipelines: Advanced LLM Observability Patterns in 2026
TL;DR
- Braintrust Experiments create immutable eval snapshots that your CI/CD pipeline can compare — a failed quality threshold blocks the merge automatically
- Per-user cost tracking requires custom tags or the Metrics API, not default logging — add them at instrumentation time or you will rebuild from scratch later
- MLflow 3 on Databricks ships native GenAI tracing with OTel-compatible auto-instrumentation, but OTel GenAI semantic conventions are still experimental in 2026 — pin your attribute names
You shipped a prompt change on Tuesday. By Thursday, support tickets were up. Costs had doubled. Output format was inconsistent. Nobody caught it — because your observability stack only told you the calls were completing, not whether they were completing correctly.
That’s the gap this guide closes. Basic LLM Observability tells you what happened. Advanced observability tells you whether it was right — and alerts you when it wasn’t.
Before You Start
You’ll need:
- One of: Braintrust, Arize Phoenix, Langfuse, or MLflow (this guide covers the pattern for each)
- Understanding of Distributed Tracing and how spans map to LLM calls
- Existing Prompt Logging already in place — you need a trace baseline before you can detect regressions
- Understanding of OpenTelemetry if you are using Phoenix or MLflow
This guide teaches you: How to decompose production LLM failures into three distinct gaps — regression, cost, and trace — and assign a separate tool contract to each one.
The Prompt Change That Broke Production Silently
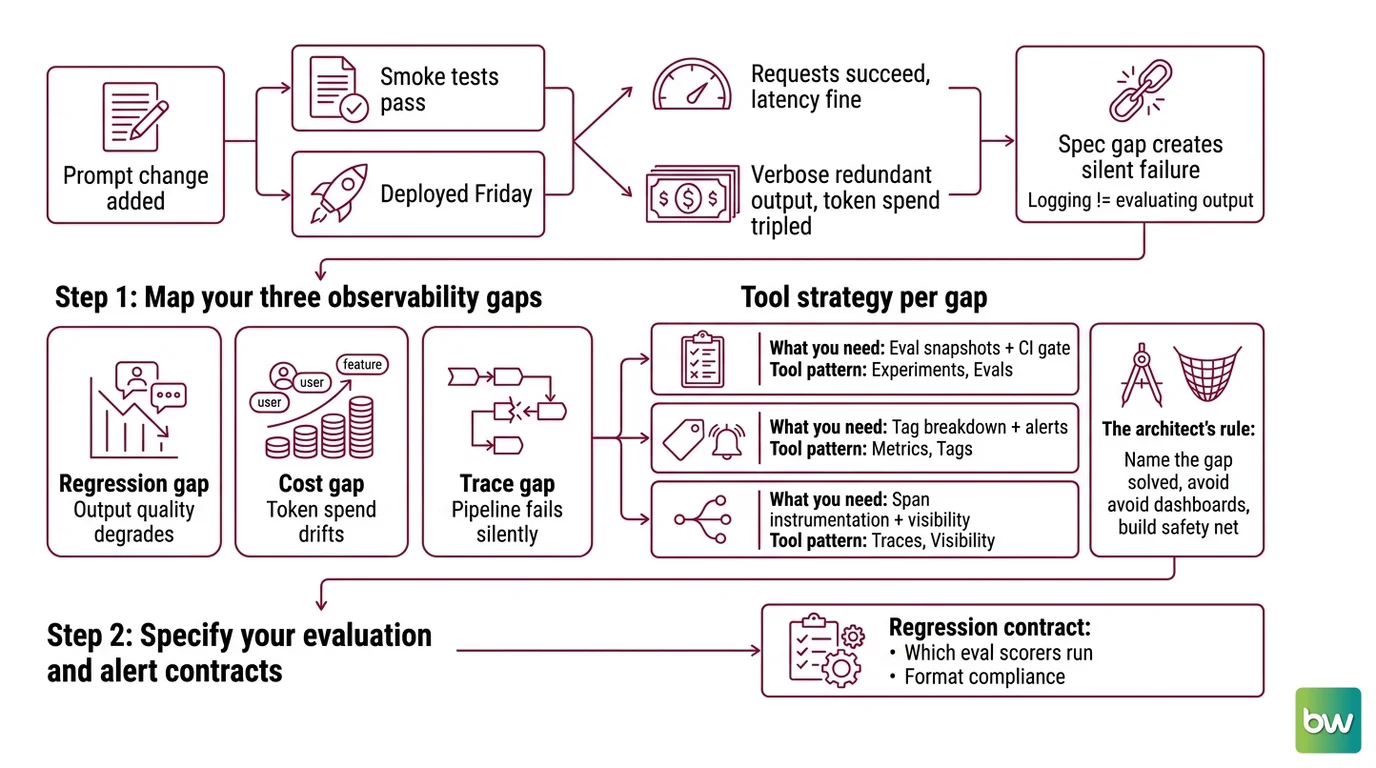
You added one sentence to your system prompt. Re-ran smoke tests. Everything passed. Deployed Friday. On Monday, your most expensive LLM feature was returning verbose, redundant output — and your token spend had tripled.
Your logs said requests succeeded. Latency was fine. You had no visibility into whether outputs were correct.
This is the spec gap that bites every team once. Logging the call is not evaluating the output. Without evaluation, your “observability” is an expensive way to watch the failure happen.
Step 1: Map Your Three Observability Gaps
Every LLM production failure falls into one of three buckets. Get this decomposition right before you instrument anything — each gap needs a different contract.
The three gaps:
- Regression gap — A prompt, model, or config change degrades output quality. You don’t know until users complain.
- Cost gap — Token spend drifts upward. No one knows which user, feature, or model is responsible.
- Trace gap — Multi-step pipelines fail silently at intermediate steps. Your final output looks wrong but the root cause is buried two calls back.
Each gap maps to a different tool strategy:
| Gap | What You Need | Tool Pattern |
|---|---|---|
| Regression | Eval snapshots + CI gate | Braintrust Experiments, Arize Phoenix evals |
| Cost | Tag-based breakdown + threshold alerts | Langfuse Metrics API, Braintrust tags |
| Trace | Span-level instrumentation + chain visibility | MLflow 3, OpenTelemetry, Phoenix |
The Architect’s Rule: If you can’t name which gap you’re solving, you’re building a dashboard, not a safety net.
Step 2: Specify Your Evaluation and Alert Contracts
Before you touch any tool, write down what “correct” means. This is the spec that keeps your observability from becoming decoration.
Regression contract:
- Which eval scorers run against outputs — relevance, faithfulness, format compliance?
- What threshold blocks a merge? What’s the baseline Experiment you’re comparing against?
- Which prompt IDs and model versions are in scope?
Cost contract:
- Which dimensions do you track — user, feature, model, environment?
- What threshold triggers a Slack notification versus a PagerDuty page?
- Is the budget per-call, per-user-per-day, or per-feature-per-month?
Trace contract:
- Which intermediate steps in your pipeline need named spans?
- What inputs and outputs does each span capture?
- Are there PII fields that must be masked before logging?
- What’s your retention window?
The Spec Test: If you configure your tool before answering these questions, you will spend two days re-instrumenting when the first alert fires for the wrong reason.
Step 3: Instrument Traces, Tags, and Evals in That Order
The three patterns have a dependency chain. Get the order wrong and you’ll be debugging your telemetry instead of your LLM.
Wire order:
- Tracing first — both evals and cost alerts consume trace data. No spans means no foundation.
- Cost tags second — add them at instrumentation time. Retrofitting tags to existing traces is painful and error-prone.
- Eval pipeline third — depends on a stable trace schema and correctly tagged spans.
For MLflow 3 on Databricks:
MLflow 3.13.0 ships native GenAI tracing with one line of auto-instrumentation in your notebook or job — every LLM call is captured with inputs, outputs, and intermediate steps (MLflow Releases). The Databricks integration adds Genie Code, a natural-language interface for querying traces directly from the Databricks UI (Databricks Docs). Retention aligns with Databricks storage policies — define your window before you start logging if you have compliance requirements.
For Arize Phoenix:
Phoenix v2.10.0 builds on OpenTelemetry via the arize-phoenix-otel wrapper package (Phoenix Docs). Your spans automatically carry standard GenAI attributes: gen_ai.request.model, gen_ai.usage.input_tokens, gen_ai.usage.output_tokens. Phoenix eval pipelines run up to 20× faster than naive sequential scoring due to built-in concurrency and batching (Phoenix Docs).
Two caveats before you commit. First, OTel GenAI semantic conventions are still experimental as of 2026 — attribute names can change across minor releases (OpenTelemetry Blog). Pin the version and test attribute names after every upgrade. Second, Phoenix ships under the Elastic License 2.0, which prohibits offering it as a managed service — if your team is considering white-labeling or SaaS deployment on top of Phoenix, you need a commercial agreement with Arize (Phoenix GitHub).
For cost tracking with Langfuse:
Langfuse’s Metrics API gives programmatic access to aggregated cost, token counts, and trace data broken down by user, feature, and model (Langfuse Docs). The key: set up user_id, session_id, or custom metadata tags at trace creation time. Without them, the Metrics API has nothing to group by. Spend alerts fire at configured thresholds. The Core plan starts at $29/month with 90-day retention and unlimited users (Langfuse Pricing). Note: the Hobby tier is limited to 2 users — if you have more than one engineer on the system, Core is your floor.
For Braintrust Experiments:
An Experiment is an immutable, named eval snapshot — a point-in-time record of how a specific prompt and model combination scored against your test set (Braintrust Docs). Your CI/CD pipeline creates a new Experiment on every prompt change, compares it against the baseline, and blocks the merge if quality drops below threshold via a GitHub Action gate. Custom tags enable cost breakdowns by user, feature, model, or environment — all in the same dashboard (Braintrust Docs). The Pro plan covers 5 GB processed data and 50K scores at $249/month (Braintrust Pricing).
Step 4: Validate Each Gap With a Known Failure
Most teams skip this. Your observability stack is not validated until you prove it catches a known bad input.
Validation checklist:
- Regression detection: Introduce a deliberately degraded prompt — remove a key instruction. Confirm the CI gate fails. Failure looks like: the Experiment runs but no alert fires, meaning your threshold is too low or your scorer is misconfigured.
- Cost alert: Generate a burst of calls that exceeds your daily threshold. Confirm the Slack or PagerDuty alert arrives within your SLA window. Failure looks like: alert fires 30 minutes late, meaning your alert polling interval needs adjustment.
- Trace completeness: Trace a multi-step pipeline where one intermediate step has a known bad output. Confirm the span captures that step’s output. Failure looks like: the trace shows start and end but nothing in between, meaning a manual step was missed by auto-instrumentation.
- Tag propagation: Run a call with a known user tag. Query the Metrics API and confirm the cost appears under that user. Failure looks like: all costs land in an “untagged” bucket, meaning tags aren’t being passed through your LLM client wrapper layer.
Common Pitfalls
| What You Did | Why It Fails | The Fix |
|---|---|---|
| Logged calls without eval scorers | Pass/fail tells you nothing about output quality | Define at least two scorers before going live |
| Set a cost alert without user tags | Alert fires but you can’t find the source | Add user_id and feature_id tags at instrumentation time |
| Treated OTel GenAI attributes as stable | Experimental spec — attribute names changed in a minor release | Pin the OTel version and test attribute names after every upgrade |
| Ran evals sequentially on a large test set | Eval pipeline takes 45 minutes — nobody uses it | Use Phoenix’s concurrent eval runner; the speedup is real |
| Built Experiments but skipped the CI gate | Manual reviews get skipped under deadline pressure | Wire the GitHub Action; make the gate automatic, not optional |
Pro Tip
Observability specs age. Your eval scorers for v1 of your prompt are measuring the wrong things by v3. Build a scorer review step into your quarterly prompt audit — not just a fresh eval run, but a deliberate check of whether each scorer still measures what matters. The metric that protected you six months ago may be measuring a solved problem while a new failure mode goes undetected.
Frequently Asked Questions
Q: How to detect LLM prompt regressions automatically with Braintrust or Arize Phoenix? A: Braintrust uses immutable Experiments: each CI run creates a named eval snapshot, compares it against your baseline, and blocks the merge if scores drop below threshold via GitHub Action. Phoenix evaluates with built-in concurrency — up to 20× faster than sequential scoring (Phoenix Docs). The critical spec decision is defining your baseline Experiment before the first prompt change, not after. Teams that skip this have no regression floor to compare against. Pin your scorer versions the same way you pin model versions or you’ll debug scorer drift instead of prompt drift.
Q: How to set up token cost alerts and per-user budget tracking with LLM observability tools?
A: Langfuse’s Metrics API aggregates cost, tokens, and trace counts per user, model, and feature — but only if you pass user_id metadata at trace creation. Braintrust supports the same breakdown via custom tags. Set alert thresholds in two tiers — a Slack notification before you reach your daily budget ceiling, a PagerDuty page when you hit it. The hidden failure: teams often instrument correctly but forget to pass tags through their LLM client wrapper layer. Verify tag propagation against the Metrics API before considering your setup complete.
Q: How to use MLflow for LLM tracing in enterprise Databricks pipelines? A: MLflow 3.13.0 on Databricks activates native GenAI tracing with one line of auto-instrumentation — every LLM call, including inputs, outputs, and intermediate steps, is captured and browsable in the Databricks UI (MLflow Releases). Genie Code adds natural-language trace queries on top of managed MLflow (Databricks Docs). The critical enterprise spec decision is retention: trace storage follows Databricks storage policies, so set your retention window before you start logging if you have audit or compliance requirements — retroactively adjusting it means re-instrumenting.
Your Spec Artifact
By the end of this guide, you should have:
- A three-gap observability map — regression, cost, trace — with a tool assignment and a written contract for each
- A tag schema for cost tracking, defined before instrumentation begins, covering the dimensions your Metrics API queries will need
- A validation checklist with four known-failure scenarios that prove your observability stack catches each gap before users do
Your Implementation Prompt
Copy this into Claude Code or Cursor when you’re ready to spec your observability stack. Fill in the brackets before running.
You are specifying an LLM observability stack for a production system.

SYSTEM CONTEXT:
- LLM application type: [describe your pipeline — RAG, agent, summarization, multi-step chain]
- Primary LLM provider: [OpenAI / Anthropic / AWS Bedrock / other]
- Existing tracing infrastructure: [OpenTelemetry / none / existing APM tool]
- Team size accessing traces: [number of engineers]
- Compliance requirements: [retention period, PII masking rules, audit log requirements]

OBSERVABILITY GAPS TO SOLVE:
1. Regression detection: [which prompt IDs need CI gates; what quality threshold blocks a merge]
2. Cost tracking: [dimensions to track — user_id, feature_id, model, environment]
3. Trace coverage: [which intermediate pipeline steps need named spans; what each span must capture]

TOOL SELECTION:
- Eval and regression: [Braintrust / Arize Phoenix — specify reason]
- Cost alerts: [Langfuse / Braintrust — specify two-tier thresholds: warning level, page level]
- Enterprise tracing: [MLflow 3 on Databricks / self-hosted Phoenix — specify if Databricks is in stack]

WIRE ORDER:
1. Instrument all LLM calls with spans — include cost tags at this step, not later
2. Configure baseline Experiment for each prompt under CI gate
3. Set cost alert thresholds across both tiers
4. Build four validation scenarios — one per gap from the checklist

VALIDATION REQUIREMENTS:
- Introduce a known-bad prompt and confirm CI gate blocks the merge
- Generate a cost burst above threshold and confirm alert fires within [your SLA]
- Confirm user tags propagate to Metrics API query results before going live

Generate the observability spec for this system. Focus on contracts and configuration — not implementation code.
Ship It
You now have a mental model that separates three distinct observability problems — each with a different tool, a different contract, and a different validation test. Apply the wiring order: traces first, cost tags second, eval pipelines third. Skip the order and you’re debugging your telemetry instead of your LLM. Wire it right once and the safety net runs without you.
AI-assisted content, human-reviewed. Images AI-generated. Editorial Standards · Our Editors