Prerequisites for LLM ELO Ratings: Chess Elo, Blind A/B Voting, and Confidence Intervals
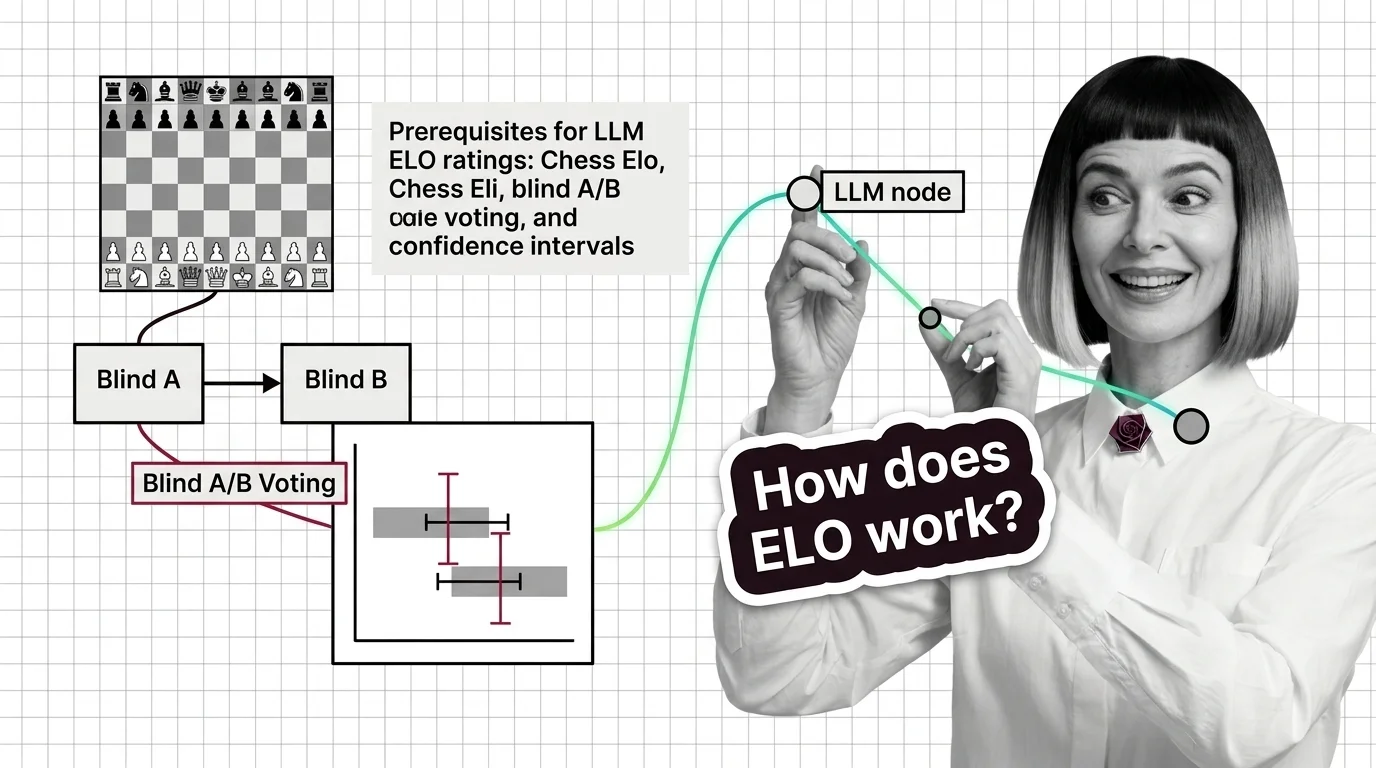
ELI5
The Elo rating system assigns a number to each competitor — chess master or language model — based on who beats whom. When top LLMs cluster within overlapping confidence intervals, the math says you can’t reliably rank them.
You open the Arena leaderboard expecting a clean ranking and find the top frontier models packed within a few dozen ELO points of each other, their error bars overlapping like interference fringes on a diffraction pattern. It looks like a dead heat. According to the statistics, it might be. Understanding why requires a short detour through 1960s chess mathematics, the mechanics of anonymous pairwise voting, and the uncomfortable geometry of confidence intervals — three concepts that are genuinely prerequisites for reading a number that otherwise looks like a simple rank.
The Geometry Arpad Elo Built for Chess Masters
In the late 1950s, competitive chess had a measurement problem. Players moved up and down through arbitrary committee rankings, with no principled basis for determining who was better by how much. Arpad Elo — a Hungarian-American physicist teaching at Marquette University who had won the Wisconsin State Championship eight times — proposed a solution rooted in probability theory (FIDE). Measure skill not by raw wins and losses, but by the difference between expected and actual outcomes.
How does the original chess ELO rating system work?
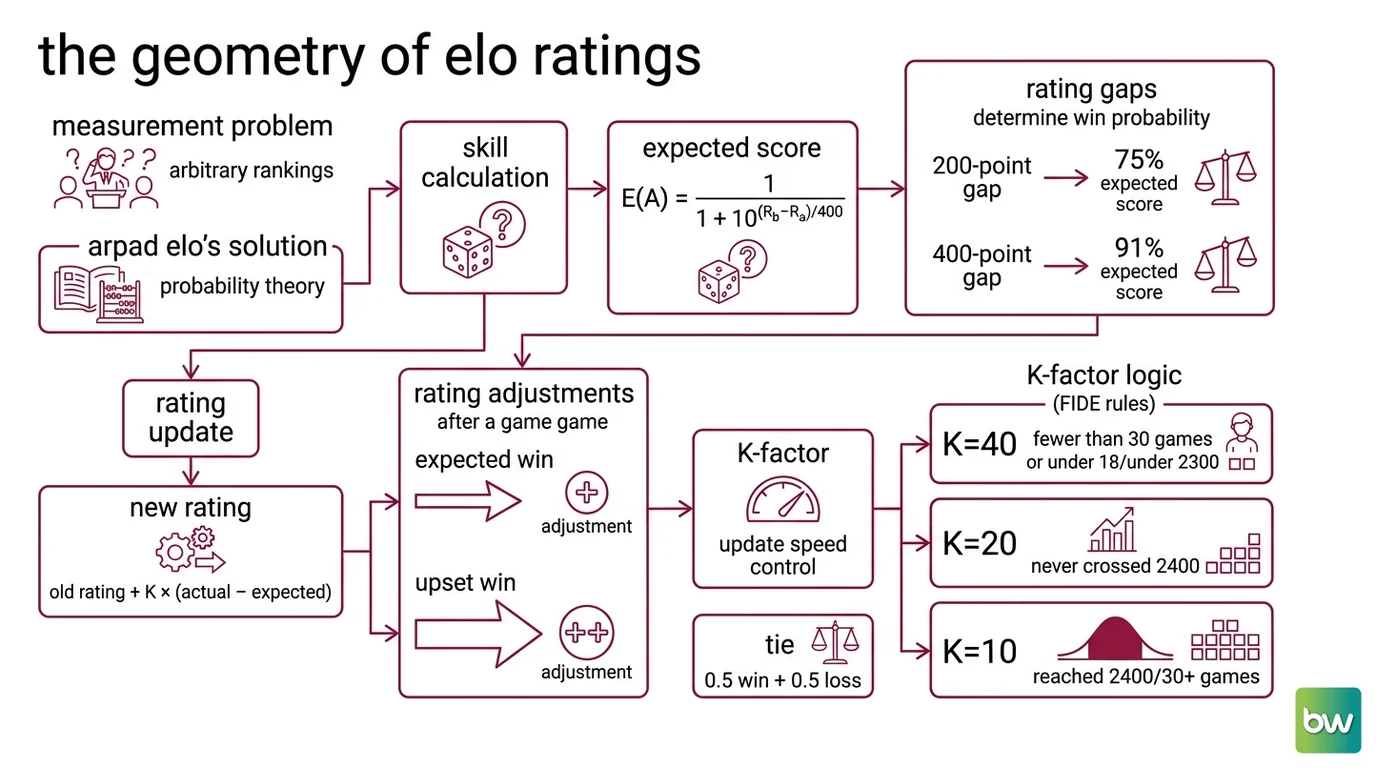
The formula Elo derived treats each match as a probability problem. Given two players with ratings Rₐ and R_b, the expected score for player A is:
E(A) = 1 / (1 + 10^((R_b − R_a) / 400))
The denominator’s base-10 exponent means that rating gaps, not absolute scores, determine win probability. A 200-point gap between players produces approximately a 75% expected score for the higher-rated player (FIDE); a 400-point gap pushes that to roughly 91% — a 10:1 ratio that follows directly from the formula’s base-10 exponent structure. These aren’t hand-tuned constants; they emerge from the logistic curve embedded in the denominator.
After each game, ratings update:
New Rating = Old Rating + K × (Actual − Expected)
When a player wins who was expected to win, K × (1 − 0.75) produces a small positive adjustment. When the lower-rated player upsets the higher, K × (1 − 0.25) produces a larger one. The K-factor controls how aggressively new information revises prior estimates. FIDE currently uses three tiers: 40 for players with fewer than 30 rated games or under 18 with ratings below 2300; 20 for those who have never crossed 2400; 10 for players who have ever reached 2400 with 30 or more games (FIDE). The logic is Bayesian: when data is sparse, update quickly. When you have decades of games, weight your prior heavily. A tie scores as 0.5 win plus 0.5 loss (LMSYS Blog).
The U.S. Chess Federation adopted the system in 1960; FIDE followed in 1970, publishing its first international rating list the next year (FIDE). What began as a physicist’s attempt to quantify human performance became the template for any comparative ranking where outcomes are probabilistic and opponents aren’t chosen by random pairing alone.
What background do you need to understand an LLM leaderboard ranking?
Three conceptual layers are necessary before the ELO Rating for LLMs number becomes interpretable rather than decorative.
The first is the chess formula above — specifically the expected score curve and its sensitivity to gaps. A 20-point lead between frontier models is not “20 points better” in any intuitive sense. It corresponds to a specific win-rate prediction under the logistic function. Without that, you’ll either overread small differences or dismiss large ones.
The second is understanding what Human Evaluation for AI measures and doesn’t measure. Chess Elo tracks performance on a fixed, rule-governed task with a binary outcome. ELO Rating applied to language models tracks something fundamentally different: human preference between two responses. There is no checkmate. The outcome depends on the prompt, the rater’s background, and what the rater weighs — concision, correctness, stylistic appeal, or confidence. The same model producing the same output can win or lose depending on who votes.
The third is the distinction between a preference leaderboard and a capability benchmark. Tools like SWE Bench measure task completion against ground truth — objective, reproducible, independent of who runs the evaluation. Arena’s rankings measure comparative preference — how often does model A beat model B when a human chooses? A model optimized for surface-level appeal may lead on Arena without leading on coding benchmarks, and a model with a structural advantage on technical tasks may rank lower because raters prefer the style of a competitor. The two numbers are measuring related but non-identical quantities.
With those three layers in place, the leaderboard is readable. It still isn’t unambiguous.
How Arena Rewrote the Formula in December 2023
When the LMSYS group at UC Berkeley launched Chatbot Arena in April 2023, they adapted Elo’s framework for a crowdsourced online platform (Chatbot Arena Paper). The mechanism: a user submits a prompt, two language models generate responses in parallel, the user votes for the preferred response — then the model identities are revealed. Everything about the comparison is anonymous until the vote is cast.
The anonymity is not cosmetic. If users knew which model they were evaluating, votes would encode prior beliefs, brand effects, and reputation. The blind setup suppresses those confounds — the same principle behind double-blind pharmaceutical trials. You prevent the observer’s expectations from contaminating the measurement.
But the LMSYS team encountered a structural mismatch. Online Elo was built for entities that change over time. A chess player’s performance degrades with age, improves with training, fluctuates under stress. When Magnus Carlsen has a poor year, his rating should fall. Language models are static artifacts. GPT-4 at release is the same computational object six months later. It neither improves nor degrades between evaluations; game order carries no information; and the complete history of pairwise votes is always available for analysis.
In December 2023, Arena replaced online Elo with the Bradley Terry Model, estimated via Maximum Likelihood Estimation over the full match history (LMSYS Blog). Bradley-Terry computes a strength parameter πᵢ for each model, where P(i beats j) = πᵢ/(πᵢ + πⱼ) and πᵢ = e^xᵢ. MLE finds the parameter values that make the observed vote history most probable, using all votes simultaneously rather than sequentially. The result is more stable than online Elo because it doesn’t discount earlier observations through sequential updating.
By June 2026, Arena had accumulated more than 6.8 million pairwise votes across more than 360 models (LocalAIMaster). The platform rebranded from lmarena.ai to arena.ai in January 2026, following a $150 million Series A (Swfte Leaderboard). That same month, a vote pipeline overhaul caused ELO score shifts of 30 or more points across many models — not because model quality changed, but because the vote processing infrastructure changed (Bradley-Terry Explainer). Any comparison of scores that crosses the January 2026 boundary requires this caveat.
What the Confidence Intervals Actually Tell You
A single ELO number is a point estimate. Point estimates are seductive — they imply a precision the underlying data may not support. Arena addresses this by computing confidence intervals through bootstrap resampling: repeatedly resample the observed match history, fit Bradley-Terry on each resample, and measure the spread of the resulting score distribution. That spread defines the interval. The method accounts for sampling variance without making parametric assumptions about the distribution of outcomes.
Why do the top LLMs have overlapping confidence intervals on the ELO leaderboard?
The width of the interval depends on how many pairwise votes a model has accumulated. For well-established models with large vote counts, CI widths of ±4 to 7 ELO points are typical. For newer models with fewer matchups, those intervals widen to ±10 to 15 points (Arena CI article). Stable rankings require at least 5,000 pairwise votes as of 2026 (Arena CI article). The bootstrap methodology specifics — number of resamples — come from practitioner accounts rather than the LMSYS blog itself, which confirms bootstrap resampling without specifying the precise permutation count.
Now consider the top of the leaderboard. As of June 2026, frontier models cluster in approximately the 1490–1525 ELO range for the top tier, with the broader top 10 spanning roughly ~55 ELO points — the tightest spread on record, according to Tier 3 aggregators; the arena.ai live leaderboard did not serve data for direct verification. A gap of 20 points falls entirely within the ±4–7 point intervals of well-tested models, and well within the wider intervals of newer entrants. Practitioner convention treats gaps below 25 ELO points as statistical noise rather than meaningful differentiation — a threshold derived from observing interval behavior on the platform, not from a peer-reviewed methodology paper (LocalAIMaster). The top 10 routinely cluster within overlapping 95% confidence intervals.
The result is a leaderboard where the difference between rank 1 and rank 5 is, under many conditions, mathematically indistinguishable from noise. Not a flaw. The honest answer from the data. The models are close, and without additional votes, the variance is too wide to settle the ranking.
There is a second confound that confidence intervals cannot resolve: the heterogeneity of the raters themselves. Inter Annotator Agreement between different Arena voters is never measured. The ratings aggregate preferences across an enormous, self-selected population with varied prompting styles and different implicit criteria for what makes a response better. In structured evaluation contexts — where researchers explicitly want to control rater consistency — frameworks like Rubric Design and annotation platforms like Label Studio enable tracking of Cohen's Kappa between annotators. Arena has no equivalent. The LLM as a Judge approach avoids human heterogeneity by using a model as the rater, but introduces model-specific biases in their place. Both instruments have systematic errors; they just make different measurement assumptions.
If you compare Arena rankings to objective capability metrics — SWE-bench task completion scores, for instance — rank order discrepancies are common. Preference and capability correlate, but they don’t coincide.
Rule of thumb: A 50+ ELO point gap represents a meaningful difference you’d likely detect in side-by-side comparison. A gap below 25 points tells you only that you need more votes — not that one model is better (LocalAIMaster).
When it breaks: The Bradley-Terry model assumes human preference is transitive — if humans prefer A over B and B over C, they also prefer A over C. This assumption fails when models occupy stylistically different niches. A model optimized for concise, high-information responses and one optimized for elaborated reasoning may both defeat a mediocre middle-ground model, yet swap their wins depending on the prompt type. When the population of queries is diverse and the distribution of rater preferences is multimodal, the single strength parameter collapses heterogeneous signal into a number that misrepresents the underlying structure of the comparisons.
The Data Says
The Elo formula from chess translates cleanly to LLM evaluation at the level of its mathematical scaffolding; what changes are the object being measured (preference, not checkmate) and the estimation method (Bradley-Terry MLE, not sequential updates). At the frontier, as of mid-2026, the honest reading of Arena rankings is that several models are statistically indistinguishable on general preference — and that the confidence intervals are correctly expressing that uncertainty, not hiding it. The number that looks like a ranking is, in many cases, a well-calibrated statement of what the data cannot yet decide.
AI-assisted content, human-reviewed. Images AI-generated. Editorial Standards · Our Editors