Optimizing for the Wrong Number: How F1 Score Masks Disparate Impact in High-Stakes Classification
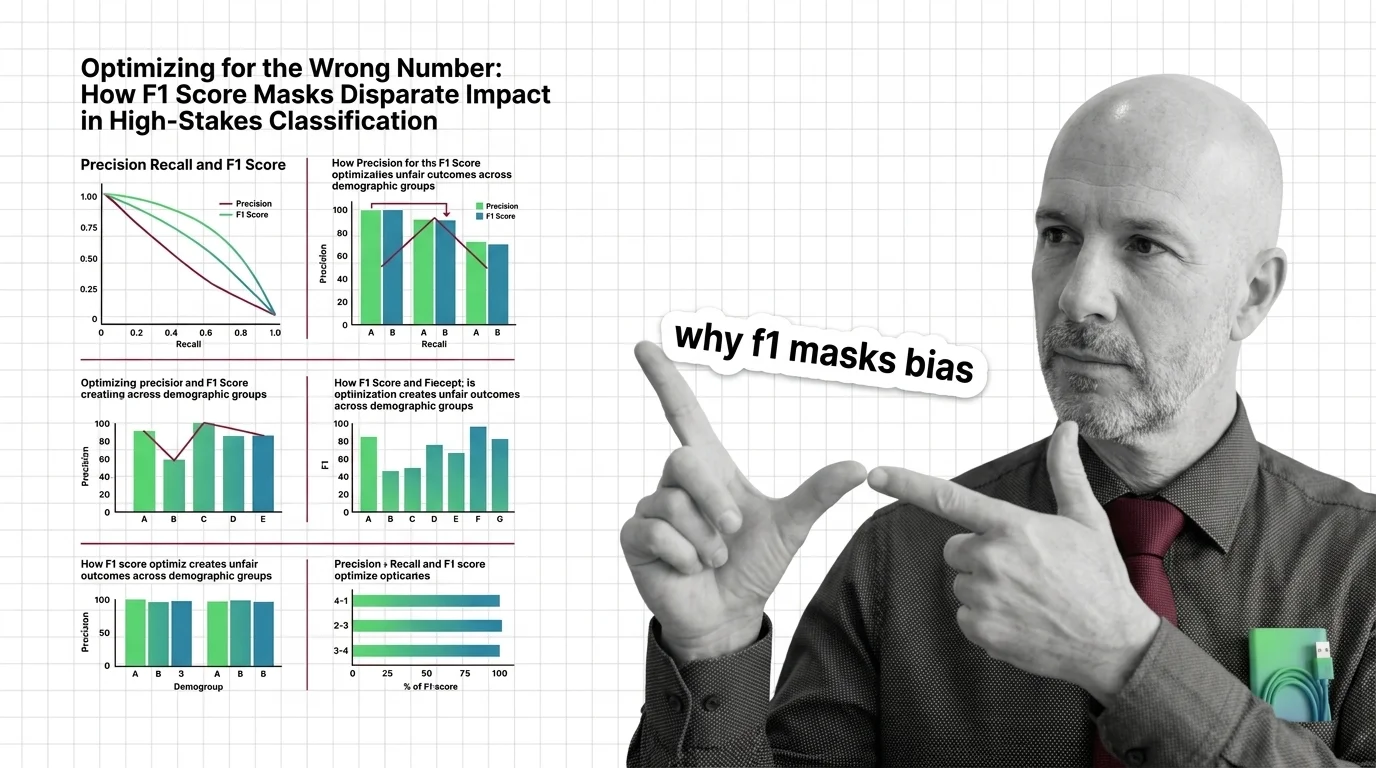
Table of Contents
The Hard Truth
A recidivism model scores 0.78. The team celebrates, procurement clears, the system goes live. Two years later, an investigation reveals the model was nearly twice as likely to wrongly flag Black defendants as high-risk. The metric never lied — it just never asked the right question.
We have built an entire infrastructure of trust around single numbers. A model’s Precision, Recall, and F1 Score becomes its report card, its defense in review meetings, its shield against scrutiny. But a number that describes average performance across a population tells you nothing about what happens at the margins — and in high-stakes classification, the margins are where people live.
The Comfort of a Single Number
There is something deeply reassuring about a metric that fits in a dashboard cell. F1 score — the Harmonic Mean of precision and recall — promises balance. It penalizes models that sacrifice one for the other, which feels responsible. It collapses the full complexity of a Confusion Matrix into a scalar, which feels efficient. And it gives decision-makers a number they can compare across models, teams, and vendors, which feels objective.
This is not a trivial achievement. In a field crowded with competing evaluation frameworks — Roc Auc, Matthews Correlation Coefficient, log loss, Brier score — F1 provides a common language. The appeal is not ignorance but exhaustion. When a procurement committee needs one answer to “is this model good enough,” F1 delivers it cleanly.
But “good enough on average” and “good enough for everyone” are different claims, and F1 has no way to distinguish between them.
In Defense of the Harmonic Mean
Before diagnosing what F1 hides, it is worth understanding what it does well. In datasets with severe Class Imbalance, accuracy becomes meaningless — a model that predicts “no cancer” for every patient achieves 99% accuracy when only 1% have cancer, and that model saves no one. F1 emerged to address exactly this failure. By requiring both precision and recall to be high, it forces a model to actually identify the minority class rather than ignoring it for a flattering accuracy number.
For many applications, this is the right tool. In spam detection, in manufacturing defect classification, in the document retrieval domain where F1 was born — it serves as a reliable guard against classifiers that game accuracy by being useless. The harmonic mean is elegant machinery for a specific engineering problem.
The question is what happens when you carry that machinery into courtrooms and hiring pipelines — systems where the “minority class” is not spam but human beings, and where the cost of a false positive falls on a person who never consented to being scored.
What Disappears When You Average
The hidden assumption inside every aggregate F1 score is uniformity. The metric treats the dataset as a single population and returns a single number. A high aggregate F1 score contains no mechanism to reveal whether that performance is consistent across demographic groups or whether it conceals a sharp disparity between them — strong results for one population, failing results for another, compressed into one reassuring figure.
This is not a theoretical concern. A Classification Threshold optimized to maximize aggregate F1 can simultaneously maximize Disparate Impact, because the threshold that works best on average is not the threshold that works fairly for groups with different base rates. Chouldechova’s impossibility theorem formalizes the trap: you cannot simultaneously equalize false positive rates, false negative rates, and positive predictive values across groups unless the base rates are equal (Chouldechova 2017). Base rates are almost never equal.
The metric does not lie. It aggregates. And aggregation, in the presence of demographic difference, is a form of erasure.
Broward County and the Inbox
In 2016, ProPublica published an investigation into the COMPAS recidivism algorithm, used in courtrooms to inform pretrial detention decisions. Analyzing cases from 7,214 defendants in Broward County, Florida — data from 2013 and 2014 — the investigation found that COMPAS achieved an overall accuracy of 61%, dropping to around 20% for violent crime prediction (ProPublica). But the aggregate concealed a deep asymmetry: the false positive rate for Black defendants was 44.9%, compared to 23.5% for white defendants. The false negative rate ran in the opposite direction — 47.7% for white defendants versus 28.0% for Black defendants (ProPublica).
The system was simultaneously overpredicting risk for one group and underpredicting for another. A single aggregate metric — whether F1, accuracy, or AUC — would not surface this disparity. You would need to disaggregate. You would need to ask not just “how accurate is this model?” but “accurate for whom, and at whose cost?”
And the pattern extends beyond criminal justice. Amazon reportedly abandoned an AI hiring tool after discovering it systematically penalized female applicants — the model, trained on historical resumes from a male-dominated workforce, had learned to treat gender-associated signals as negative features (IBM). The overall performance metrics likely looked acceptable. They tend to, when the disadvantaged group is underrepresented in the training data and their errors vanish into the aggregate.
Every Threshold Is a Policy Decision
Here is the thesis this evidence demands: aggregate metrics are policy decisions disguised as engineering. When a team selects a True Positive Rate threshold that maximizes F1 for the whole population, it is implicitly deciding whose errors will be minimized and whose will be tolerated. That decision is not mathematical. It is moral. And in most organizations, it is made by people who believe they are making a technical choice.
The EEOC’s four-fifths rule offers a blunt but instructive standard: if a selection procedure produces a rate for any protected group below 80% of the highest-scoring group’s rate, adverse impact is presumed (EEOC Guidelines). The EU AI Act classifies hiring and recruitment AI as high-risk, with core requirements taking effect in August 2026 (EU AI Act). These are not engineering specifications. They are institutional acknowledgments that unconstrained optimization, left to its own arithmetic, produces harm.
Hardt et al. proposed equalized odds — requiring that a predictor’s accuracy be independent of the protected attribute, conditional on the true outcome — as one formal path toward fairness (Hardt et al. 2016). Tools like Fairlearn now provide disaggregated subgroup analysis through MetricFrame and functions such as equalized_odds_difference. But Scikit Learn — the most widely used ML library — still does not include native fairness metrics. Fairness remains external. An afterthought. Something you add if you remember to look.
Who decides whether to look?
The Questions We Owe the Data
If a single aggregate metric creates the illusion of fairness while concealing group-level harm, the responsible path is disaggregation. Evaluate by subgroup. Report by subgroup. Make the asymmetries visible before they calcify into institutional practice.
But this is harder than it sounds, and not only technically. Disaggregation requires knowing which groups to examine, which requires collecting demographic data, which raises entangled questions of privacy and consent. It requires choosing which fairness definition to prioritize — and the impossibility theorem guarantees we cannot satisfy them all simultaneously. It requires, perhaps most painfully, institutional willingness to confront numbers that may delay a launch, complicate a narrative, or reveal that the celebrated model is not performing equally for everyone it affects.
The question is not whether to measure fairness. The question is whether organizations will treat fairness metrics as hard constraints — limits that override optimization targets — or as reports, read after the model has been running for years and the damage has already been distributed.
Where This Argument Is Weakest
This position depends on the availability of meaningful demographic categories for disaggregation. In some domains, those categories are legally defined and well-understood. In others, they are contested, fluid, or unavailable. Intersectional analysis — examining combinations of race, gender, age, disability — compounds the challenge, as subgroup sample sizes shrink rapidly and statistical reliability erodes.
If disaggregated evaluation itself introduces instability — small-sample noise presenting as signal, or categories that reify social constructs rather than illuminate them — then the cure may carry its own pathology. I would reconsider this argument if evidence consistently showed that mandatory disaggregation produced worse outcomes for the groups it intended to protect, or if a workable single metric emerged that could capture distributional fairness without requiring group labels.
The Question That Remains
We designed metrics to make models legible. But legibility is not accountability. F1 score tells you how a model performs — it does not tell you who pays the cost when it fails. Until that second question becomes a first-class requirement in every evaluation pipeline, the number on the dashboard will remain a mirror that flatters the builder and erases the subject.
Disclaimer
This article is for educational purposes only and does not constitute professional advice. Consult qualified professionals for decisions in your specific situation.
AI-assisted content, human-reviewed. Images AI-generated. Editorial Standards · Our Editors