LLM Load Testing Architecture: Key Components, Metrics, and What to Know Before You Start

ELI5
LLM load testing measures how an inference endpoint handles concurrent requests — focusing on streaming latency metrics (TTFT, inter-token delay) that standard tools miss. Run it before you scale, or you’ll scale the wrong thing.
Teams point k6 at their LLM endpoint, observe sub-200ms P99 response times, and call it production-ready. Users then report a chatbot that falls silent for three seconds before generating its first word. The measurement was technically correct and completely useless.
The problem is structural: an LLM response isn’t a JSON payload delivered as a single unit. It is a token stream with at least two computationally distinct phases, each shaped by different hardware bottlenecks. Standard load testers were built to measure monolithic responses. They are architecturally blind to everything that makes LLM latency interesting — and everything that makes it painful.
Why Inference Is Not a Request-Response Cycle
LLM Load Testing inherits almost nothing from conventional API load testing beyond the concept of “concurrent requests.” The mechanical difference runs deeper than tool configuration; it starts with how Inference actually works. Understanding that distinction determines whether your test is measuring your system or measuring a fiction about it.
What do you need to understand about LLM inference before running load tests?
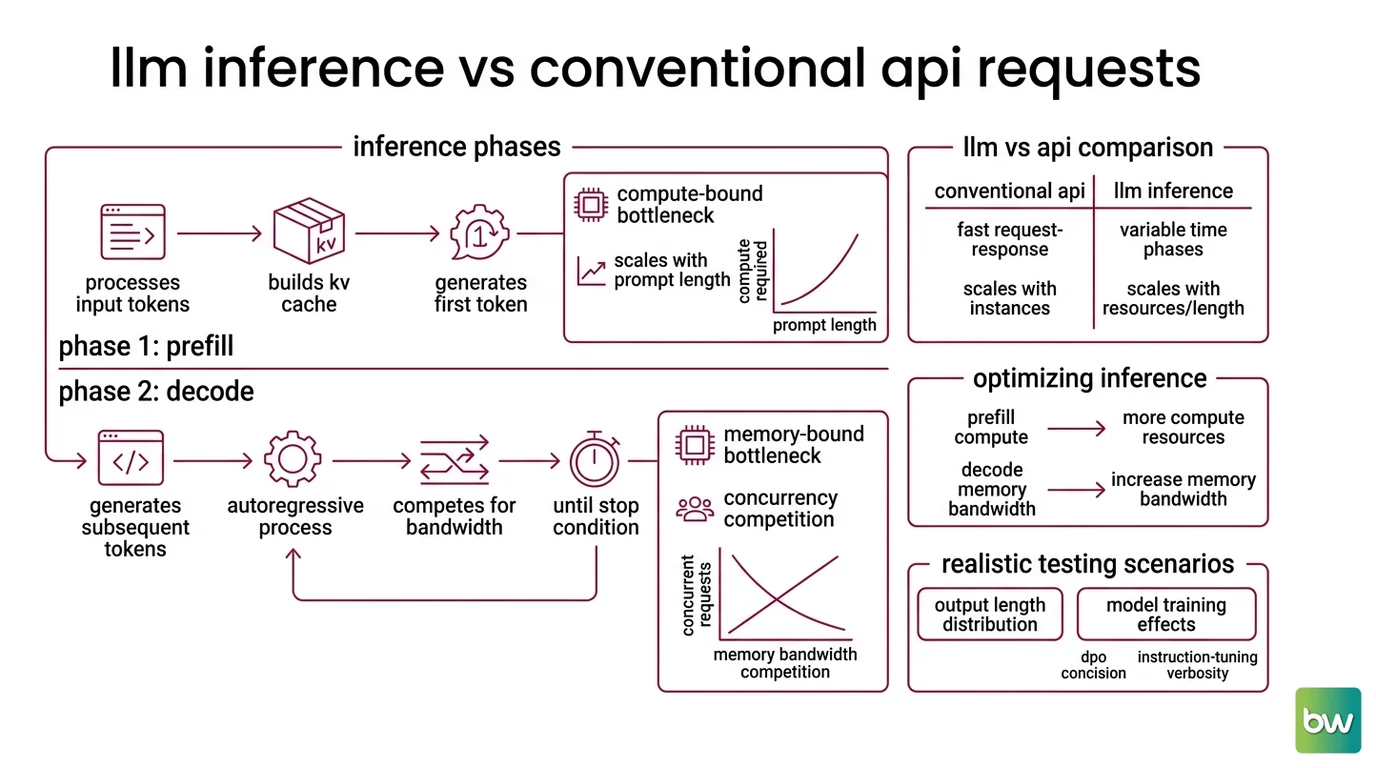
LLM inference divides into two phases with different cost structures, different bottlenecks, and different user-visible consequences.
The first is prefill: the model processes all input tokens simultaneously, builds the KV cache for those tokens, and produces the first output token. Prefill is compute-bound and scales with prompt length — a 4,000-token prompt requires roughly four times more prefill computation than a 1,000-token prompt. The entire prefill phase completes before the user sees anything.
The second is decode: the model generates one token at a time, autoregressively, until it reaches a stop condition. Each decode step depends on the KV cache accumulated during prefill and the tokens generated so far. Under concurrency, decode steps from multiple requests compete for GPU memory bandwidth — a subtly different bottleneck than prefill’s compute dependency. Prefill is compute-bound; decode is memory-bound. The distinction determines which optimization lever helps under which load pattern.
One more prerequisite for realistic load testing: your scenarios need representative output length distributions. The model’s training methodology shapes this more than most practitioners expect. A model fine-tuned with DPO for concision can produce responses half as long as a verbose instruction-tuned baseline given identical prompts — which means the same concurrency profile stresses two meaningfully different systems. If your synthetic scenarios produce short responses but your production prompts elicit long document-style answers, you have load-tested a fictional system.
What is the difference between TTFT, inter-token latency, and end-to-end latency in LLM benchmarking?
Three metrics define the temporal shape of an LLM response. They measure fundamentally different things, and conflating them is where most initial load tests go wrong.
TTFT (Time to First Token): The interval from the moment a request leaves the client to the moment the first output token arrives. This covers network round-trip, any queue wait if the endpoint is at capacity, and the entire prefill phase (BentoML Inference Handbook). TTFT is what users experience as “thinking time” — the silence before the model begins responding. It is also the metric most sensitive to concurrency because prefill jobs queue behind each other.
ITL / Inter Token Latency: The gap between two consecutive output tokens during the streaming decode phase. This is what users perceive as “typing speed” — the visible velocity of the response. Under light load, ITL for most models stays well below 50ms. Under heavy concurrency, continuous batching redistributes GPU cycles across requests, and ITL degrades noticeably before aggregate throughput numbers show any sign of pressure.
TPOT (Time Per Output Token): Average time per output token after TTFT, calculated as (E2EL – TTFT) ÷ (output_tokens – 1), where end-to-end latency is TTFT + (TPOT × num_output_tokens) (AWS Neuron Docs). For a single isolated request, mean ITL equals TPOT exactly. The distinction surfaces at scale: across many concurrent requests, ITL is token-weighted while TPOT is request-weighted — they diverge under load in ways that reveal different congestion patterns (BentoML Inference Handbook).
Not the same metric. Different weighting, different bottleneck signal.
A test measuring only end-to-end latency can show a stable average while TTFT has tripled and ITL has doubled — because the two components average each other out. The aggregate looks fine. The user experience does not.
The Anatomy of an LLM Load Testing Stack
Building a sound LLM load testing framework means assembling components that operate at different levels of the problem. Each layer handles a responsibility the others cannot substitute for, and skipping any one of them produces a test that answers a different question than the one you meant to ask.
What components make up an LLM load testing framework?
1. A streaming-native load generator
The load generator must connect to the inference endpoint, maintain concurrent connections, and track per-token events throughout the streaming response — not simply record a final timestamp when the response closes.
Two tools built specifically for this:
AIPerf v0.10.0 (NVIDIA/ai-dynamo): Tracks TTFT, ITL, TPOT, and requests per second, distributed across P25–P99 percentiles. OpenAI-compatible endpoints. NVIDIA’s current recommended benchmarking tool for NIM and Triton workloads (AIPerf GitHub).
LLMPerf (ray-project): Built on Ray for distributed concurrent testing. Covers Anyscale, OpenAI, Anthropic, Together.ai, Fireworks.ai, Perplexity, HuggingFace, Lepton AI, and LiteLLM-compatible endpoints (LLMPerf GitHub). Best suited for cross-provider TTFT and ITL comparison.
k6 and Locust are popular general-purpose tools that teams sometimes adapt for LLM testing. Both carry structural limitations that make them unreliable as primary tools: k6 treats the entire streaming response as a single unit, recording total response time without capturing TTFT or ITL; Locust’s Python GIL causes tokenization logic to compete directly with request generation under load (TianPan Blog). Community extensions exist for both, but they are adaptations of varying maturity, not native streaming support.
Compatibility note:
- GenAI-Perf ( GenAI-Perf, deprecated January 2026): NVIDIA officially deprecated GenAI-Perf — no new feature development. Users are being migrated to AIPerf. If your current tooling references
perf_analyzeror GenAI-Perf, migrate before your next benchmark cycle (NVIDIA Triton GitHub).
2. A scenario definition layer
A scenario specifies concurrency profiles (simultaneous request counts, ramp-up curves), prompt distributions (length, format, topic diversity), and expected output length ranges. Realistic scenarios are the hardest component to produce correctly — and the most frequently skipped.
Without representative inputs, you cannot know whether your KV cache is sized appropriately, whether your LLM Gateway is introducing queue latency, or whether your Model Routing layer is bottlenecked on routing decisions rather than generation. A test that uses uniform short prompts will miss the prefill saturation that long-context production queries produce.
3. An SLO evaluation layer with goodput measurement
Raw throughput is the wrong primary metric for production capacity. Requests that complete outside your latency budget do not represent real serving capacity. The emerging term for the right metric is goodput, not throughput: requests per second that complete while meeting the SLO constraint (BentoML Inference Handbook). A server reporting high raw throughput might deliver considerably lower goodput if a large fraction of requests breach TTFT targets.
The Rate Limiting layer of your serving infrastructure interacts directly with goodput: an aggressive rate limiter can throttle requests before they queue, artificially improving TTFT while reducing visible throughput. Load tests must probe goodput under the same rate-limiting configuration as production, or the test is measuring a different system.
The Numbers That Actually Predict Production Behavior
Once the tooling is in place, the question becomes: what do you optimize for, what do you monitor, and what represents an actual failure? The metrics don’t converge on a single answer — they form a system of constraints where the most important signal shifts by use case.
What metrics matter most when load testing an LLM inference endpoint?
TTFT P99 as the primary production signal. P99 TTFT is the latency experienced by the least-served 1% of users in a given window — the slowest requests, not the average. For interactive chat applications, industry guidance places a P99 TTFT threshold at ≤ 300ms; voice agent applications tighten that to ≤ 150ms (the TTS pipeline adds another 100–200ms after the LLM finishes); inline code completion drops further to ≤ 100ms (Spheron Blog). These numbers reflect practitioner benchmarks on common infrastructure stacks, not formal perceptual standards — treat them as calibration points rather than universal thresholds.
The concurrency cliff in TTFT P99. P99 Latency does not degrade linearly with concurrency. As a reference from production benchmarking: P99 TTFT at 8 concurrent requests sits around 90ms; at 32 concurrent requests it reaches 280ms; at 64 concurrent requests it climbs to 480ms — past the interactive-chat threshold entirely (Spheron Blog). P99 TTFT collapses under concurrency while average response times and aggregate RPS can still look stable — because the tail of the distribution has already moved outside SLO before the aggregates show any sign of pressure.
inter-token latency for streaming UX. Tokens Per Second is the inverse of ITL and describes how fast the visible response grows. For chat interfaces, a P99 ITL above 50ms is perceptible as stuttering. For document-generation workloads where users don’t watch the response stream in real time, ITL matters less than total end-to-end latency — but it should still appear in your test output so that future changes to batching configuration don’t silently degrade streaming quality.
Goodput as the capacity number that actually matters. Apply your SLO thresholds to the evaluation layer and measure how many requests per second the endpoint delivers while honoring them. When goodput declines faster than raw RPS under increasing load, you have identified the operational ceiling that users will actually feel — not the theoretical maximum the hardware can process.
The Concurrency Cliff and What It Implies for Capacity Planning
The concurrency effect on TTFT P99 has a specific shape worth understanding before you need to act on it. The relationship is not linear, and it is asymmetric: adding horizontal capacity moves the cliff to higher concurrency levels but does not flatten the curve itself.
A system that passes a load test at moderate concurrency may fail at slightly higher levels in a qualitatively different way — not gradually slower, but outside SLO boundaries within a small concurrency increment. This is partly a consequence of how continuous batching works: it redistributes decode compute across all active requests, which keeps GPU utilization high but means each individual request’s ITL grows with the batch size.
If you have LLM Fallback And Retry Patterns in your serving layer, the load test must include them in scope. A retry on a 503 from an overloaded endpoint doesn’t fix the bottleneck — it adds to the queue that caused the 503 in the first place. retry behavior under saturation should be part of what your test characterizes, not a separate concern.
Rule of thumb: Set your load test concurrency ceiling to twice your expected production peak, then measure goodput at that ceiling. The number that matters isn’t whether the system survives — it’s whether it survives while meeting SLOs.
When it breaks: SLO target numbers for P99 TTFT and ITL originate from practitioner benchmarks on specific hardware configurations; they are guidance, not portable guarantees. Models running with static batching instead of continuous batching, or with insufficient KV cache provisioning, hit the concurrency cliff at much lower request counts than the benchmarks suggest — sometimes at single-digit concurrent users. The test infrastructure must match the production serving configuration, or the cliff appears in a different place than your test found it.
The Data Says
Standard load testers record when a response closes, not when it starts speaking — and that distinction makes them structurally blind to the latency phases that actually determine whether users experience an LLM inference endpoint as responsive. TTFT P99 reveals the responsiveness ceiling, ITL reveals the streaming experience, and goodput translates both into an honest capacity number. These three metrics together surface the concurrency cliff before it surfaces in a production incident.
AI-assisted content, human-reviewed. Images AI-generated. Editorial Standards · Our Editors