How to Load Test an LLM Deployment with vLLM Benchmark Suite and GenAI-Perf in 2026
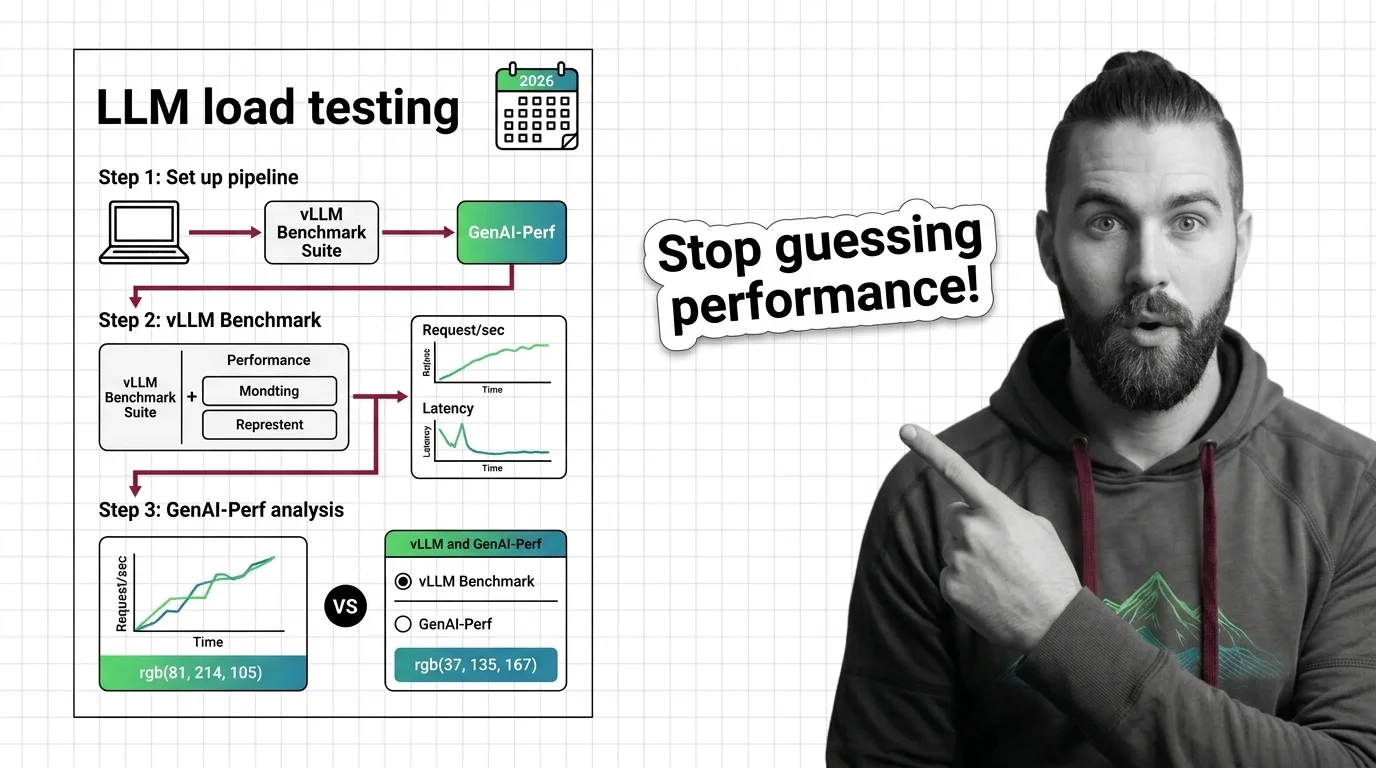
TL;DR
- Shape test traffic to match real users — request rate, burstiness, and token distributions are the spec, not just “send N requests”
- Use
vllm bench serveand GuideLLM for dedicated LLM metrics; general-purpose tools miss streaming latency decomposition - GenAI-Perf is officially phased out — use NVIDIA AIPerf for NIM and Triton endpoints going forward
You type “build a load test for my LLM API” into Cursor. It scaffolds a script that fires HTTP requests, measures response times, and outputs a latency chart. You run it. Numbers look reasonable. You ship.
Then production traffic hits — variable prompt lengths, concurrent users, streaming enabled — and every number from that benchmark is irrelevant.
The test didn’t fail because the code was wrong. It failed because the spec was missing.
Before You Start
You’ll need:
- Claude Code, Cursor, or another AI coding assistant for generating test pipeline code
- A running vLLM deployment or any OpenAI-compatible LLM endpoint
- Familiarity with LLM Load Testing metrics: Inter Token Latency, Tokens Per Second, and P99 Latency
- A picture of your production traffic: request concurrency levels, prompt length ranges, streaming vs. non-streaming
This guide teaches you: How to decompose an LLM load testing pipeline into five specifiable components so your AI coding tool builds something that measures what actually matters in production.
The Benchmark That Misled You
You ran a benchmark. Numbers looked fine. You shipped. Then production traffic landed — bursty, multi-turn, streaming — and your p99 latency for time-to-first-token was several times what your test showed.
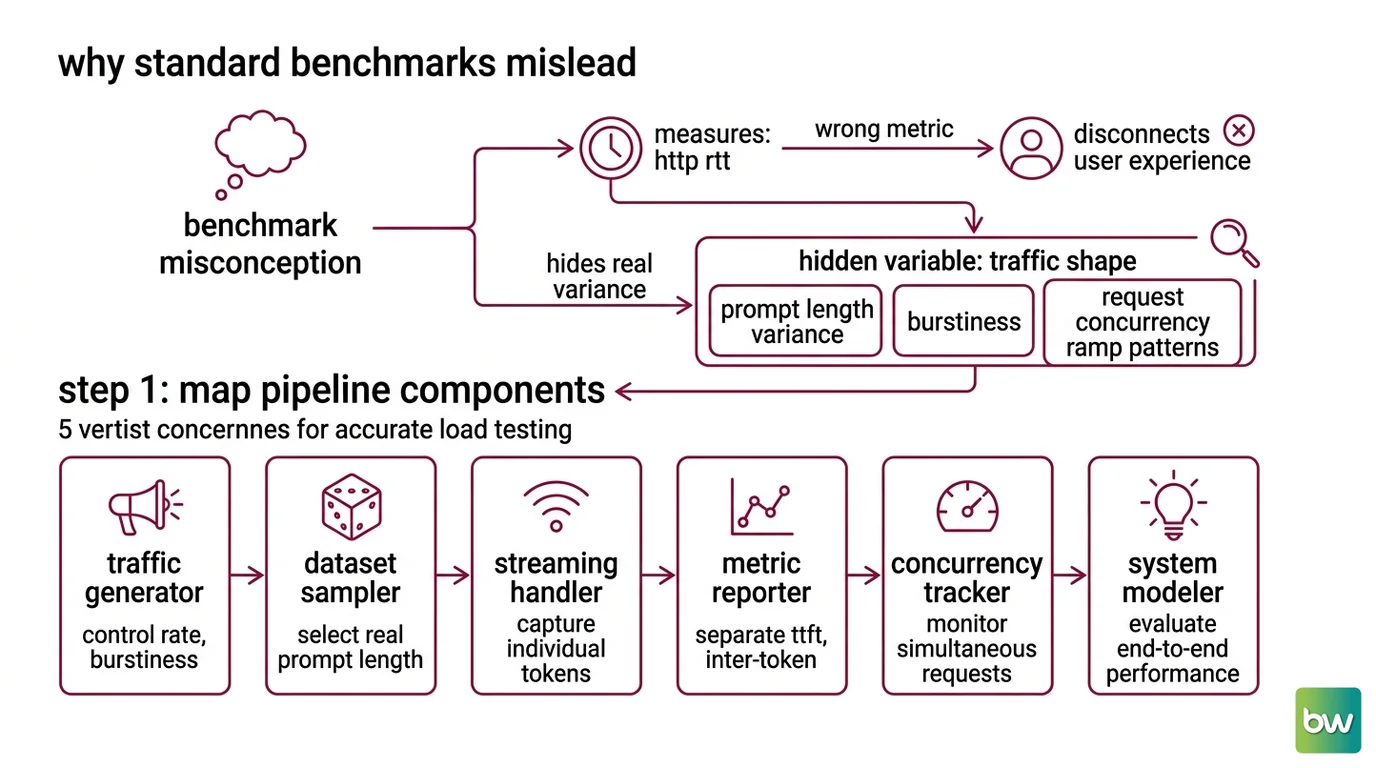
Here’s what happened. Your test measured HTTP round-trip time. When a user is waiting for the first word from the model, HTTP response time is measuring the wrong thing. TTFT and inter-token latency are separate signals from different parts of the inference stack. A tool that collapses them into one response-time metric isn’t imprecise — it’s measuring something that has no bearing on user experience.
The hidden variable is traffic shape. Prompt length variance, burstiness, and Request Concurrency ramp patterns determine whether your benchmark reflects production or tells a comfortable lie. None of those three have defaults your AI coding tool can infer. You have to spec them.
Step 1: Map the Pipeline Components
LLM load testing isn’t a single thing. It’s five distinct concerns. Your AI coding tool needs to understand each one separately — otherwise it collapses everything into one HTTP loop that misses the actual measurement problem.
Your pipeline has these parts:
- Traffic generator — controls request rate, request concurrency cap, and burstiness. Not just “fire N requests.” The arrival distribution determines whether your server sees a smooth ramp or spiky bursts that pressure the KV cache differently.
- Dataset sampler — picks prompt and expected output lengths from real distributions, not fixed values. Fixed-length prompts produce results that look better than your actual workload warrants; real traffic has variance, and variance is where deployments break.
- Streaming handler — captures SSE chunks or HTTP/2 streams and timestamps each token arrival individually. Without this, you cannot measure inter-token latency. Everything is aggregated into a single response time, which hides the decode-phase behavior that users actually feel.
- Metric collector — separates TTFT (time to first token), ITL (inter-token latency), and tokens per second from overall HTTP response time. These three have independent failure modes and independent SLAs.
- Result analyzer — outputs p99 latency breakdowns, not averages. A low median TTFT can coexist with a tail that’s an order of magnitude higher. Averages approve deployments that p99 would reject.
The Architect’s Rule: If your spec calls “load test” a single component, the AI will build a single HTTP loop. It will be fast, clean, and wrong for LLM workloads.
Step 2: Define the Metric Contract
Before your AI coding assistant writes any test logic, it needs the full context checklist. Missing any one of these shifts the burden of decision to the model, which will guess — confidently, quickly, and incorrectly for your specific workload.
Context checklist:
- Request rate — specify as a number in requests per second, or
inffor a max-throughput ceiling test - Burstiness — Gamma distribution parameter: less than 1.0 produces bursty spike arrival, exactly 1.0 models Poisson arrival, greater than 1.0 smooths toward uniform (vLLM Docs). Match your production pattern.
- Max concurrency — the ceiling that prevents a runaway test from exhausting connection pools at the server
- Prompt token distribution — sampled from a real dataset or a parameterized distribution, not hardcoded lengths
- Streaming mode — determines whether the streaming handler component is in scope; non-streaming tests skip ITL entirely
- Target SLA — TTFT p99 and ITL p99, in milliseconds, with explicit pass/fail thresholds that the result analyzer enforces
- Endpoint type — native vLLM, OpenAI-compatible wrapper, or NIM/Triton; this determines which tool handles metric extraction and which deprecated scripts to avoid
The Spec Test: If your context file doesn’t specify the burstiness parameter, your AI coding tool will default to uniform arrival. Uniform arrival patterns systematically underestimate latency at the tail — your p99 numbers will look better than what real bursty traffic produces, and you won’t know it until production incidents surface the gap.
Step 3: Sequence the Tool Stack
Build in this order. Each layer depends on the one before it, and running them out of order mixes signals that need to be isolated.
Build order:
- Baseline single-user test — run
vllm bench latencyfirst. Single user, no concurrency effects. This gives you raw TTFT and ITL with nothing competing for KV cache. Every multi-user result you see later is a delta from this baseline (vLLM Docs). - Throughput ceiling — run
vllm bench throughputwith--request-rate inf. This finds the maximum tokens per second the server sustains before saturation. You need this number before you can interpret multi-user curves. - Realistic multi-user profile — bring in GuideLLM (
pip install guidellm). GuideLLM is the vLLM-project’s recommended tool for production benchmarking — it supports token distributions and ramp profiles thatvllm benchalone doesn’t expose (GuideLLM GitHub). Check compatibility with your specific vLLM version before upgrading either independently. - Integration-layer test — only now reach for Locust or Gatling if you need to test client-side behavior, LLM Gateway routing, or Model Routing logic end-to-end. These tools belong at the integration layer, not the inference benchmarking layer.
For each component, your context must specify:
- What metrics it captures (TTFT only? TTFT + ITL? Full streaming profile?)
- What it receives as input (endpoint URL, auth headers, request schema, model name)
- What it outputs (raw per-request JSON, aggregated CSV, or streaming event log)
- What constitutes a pass or fail (explicit threshold for TTFT p99 and ITL p99)
Step 4: Validate the Results
A load test that passes isn’t done until you’ve checked each component’s output for the specific failure signatures that indicate a broken measurement — not a broken deployment.
Validation checklist:
- TTFT p99 within SLA — failure looks like: TTFT rising steadily as concurrency increases; this indicates KV cache pressure, not a bug in your test script
- ITL consistent across the request — failure looks like: ITL spike at token 1 then stabilizing; indicates speculative decoding misconfiguration or memory contention in the decode phase
- Throughput vs latency tradeoff curve visible — failure looks like: flat throughput at all concurrency levels; your
--max-concurrencycap in the spec is likely set too low - No deprecation warnings in logs — failure looks like:
benchmark_serving.pyorbenchmark_throughput.pyprinting a deprecation message and exiting; migrate tovllm bench serveandvllm bench throughputrespectively (vLLM Docs) - LLM Fallback And Retry Patterns tested separately — failure looks like: no error injection in your traffic generator spec; your test never exercised the fallback path, so your SLA for the fallback case is unknown
Common Pitfalls
| What You Did | Why AI Failed | The Fix |
|---|---|---|
Used benchmark_serving.py | Deprecated in vLLM — only prints a deprecation message and exits | Migrate to vllm bench serve |
| Reached for GenAI-Perf on a new project | NVIDIA officially phased it out — no new features will be added | Use pip install aiperf for NIM and Triton endpoints instead |
| Fixed prompt length in the test dataset | Misses token variance; results look better than your real workload warrants | Sample from real prompts or a distribution-parameterized generator |
| Used k6 without an SSE extension | k6 doesn’t support streaming natively; ITL is silently missing from your measurements | Add the xk6-ai community extension and verify its SSE streaming support before committing |
Skipped --burstiness parameter | AI defaults to uniform arrival; real production traffic is Poisson or spikier | Specify the Gamma parameter explicitly in your context file |
| Measured only aggregate latency | Averages hide tail behavior; passes deployments that p99 would reject | Require p99 breakdowns in your result analyzer output spec |
Security & compatibility notes:
- GenAI-Perf (BREAKING): NVIDIA has officially phased out GenAI-Perf — no new features will be added. Migrate to NVIDIA AIPerf (
pip install aiperf) for NIM and Triton endpoints. AIPerf measures TTFT, ITL, tokens per second, requests per second, and end-to-end latency (NVIDIA NIM Docs, NVIDIA Triton Docs).- benchmark_serving.py / benchmark_throughput.py (BREAKING): Both scripts are deprecated in vLLM as of v0.23.0 — they print a deprecation message and exit without running a benchmark. Replace with
vllm bench serveandvllm bench throughput(vLLM Docs).- vLLM Transformers v4 (WARNING): Deprecated as of vLLM v0.21.0 (May 2026). vLLM now targets Transformers v5. If your setup pins Transformers v4, plan migration before your next vLLM upgrade.
Pro Tip
The spec your AI coding tool cannot infer is your traffic burstiness. Every other constraint — endpoint URL, concurrency cap, output format — is derivable from the task description or visible in your API docs. Burstiness is a property of your specific production system: whether users arrive in waves from a frontend, whether a batch pipeline spaces requests uniformly, whether a chatbot sees clustered conversational sessions.
State it explicitly in your context file using the Gamma distribution parameter. Less than 1.0 for a bursty conversational API. Exactly 1.0 for Poisson arrival. Greater than 1.0 for a smoothed batch pipeline. Write the value down before your AI coding tool touches the test configuration — this is not a constraint you can add after the fact and expect the outputs to stay valid.
Frequently Asked Questions
Q: How to build an LLM load testing pipeline from scratch step by step?
A: Start with a single-user vllm bench latency run to establish baseline TTFT and ITL. Then find the throughput ceiling with vllm bench throughput. Layer in GuideLLM for multi-user profiles with real token distributions. Add integration tests only after isolated components pass their SLAs. One constraint at a time — mixing concurrency and traffic shaping in the same step hides which variable caused any regression you observe.
Q: How to use k6 or Locust to load test an OpenAI-compatible LLM API? A: Locust 2.44.4 works, but Python’s GIL creates timing skew under heavy concurrency — tokenization competes with request generation. Use gevent or asyncio workers to isolate them. k6 requires a community SSE extension not built into the base tool; verify it handles streaming chunks correctly before relying on its ITL readings. Neither tool ships per-token timing instrumentation out of the box — you need to add it (TianPan.co).
Q: When should you use FutureAGI Simulation instead of vLLM Benchmark Suite for load testing? A: Use FutureAGI Simulation when you need response quality scored alongside performance — it runs persona-driven multi-turn conversations and evaluates them through an eval pipeline simultaneously with the load test. vLLM bench measures raw inference performance: TTFT, ITL, throughput. Use both for different questions, not one instead of the other. FutureAGI Simulation pricing is not publicly documented, so factor that into your toolchain planning (FutureAGI Blog).
Q: Can general-purpose tools like k6 and Gatling replace dedicated LLM load testing tools? A: Partly. Gatling has native SSE support — no extension needed — making it better suited than k6 for streaming LLM endpoints. But neither understands multi-turn conversation state, measures per-token ITL natively, or connects to an eval pipeline. For pure endpoint stress testing, they work. For LLM-specific diagnostics like KV cache pressure or decode-phase degradation, you need vLLM bench, GuideLLM, or AIPerf depending on your stack (FutureAGI Blog).
Your Spec Artifact
By the end of this guide, you should have:
- A five-component pipeline map with explicit boundaries: traffic generator, dataset sampler, streaming handler, metric collector, result analyzer
- A context checklist with actual values for request rate, burstiness Gamma parameter, max concurrency, token distributions, streaming mode, and p99 SLA thresholds
- A sequenced tool stack:
vllm bench latency→vllm bench throughput→ GuideLLM → integration layer (Locust or Gatling only if your scope includes client-side and gateway behavior)
Your Implementation Prompt
Copy this into Claude Code or Cursor. Fill each bracketed placeholder from your context checklist before pasting.
Build an LLM load testing pipeline with the following components. Build them in the order listed — each feeds the next.

## Component 1: Dataset Sampler
Load prompts from [your dataset path or API]. Sample prompt token lengths from the distribution, not fixed values. Output: a stream of (prompt_text, expected_max_output_tokens) tuples.

## Component 2: Traffic Generator
Send requests to [your LLM endpoint URL] using the OpenAI-compatible chat completions API.
- Request rate: [N requests/s, or "inf" for max throughput ceiling]
- Burstiness: Gamma distribution parameter [<1.0 for bursty, 1.0 for Poisson, >1.0 for uniform]
- Max concurrency cap: [N simultaneous requests]
- Auth: [header name] = env var [ENV_VAR_NAME]
- Model: [model name]

## Component 3: Streaming Handler
Enable streaming (stream: true). Capture SSE chunks. Record timestamp of each chunk arrival. Do NOT aggregate into a single response time — per-chunk timestamps are required for ITL.

## Component 4: Metric Collector
Compute per request:
- TTFT: milliseconds from request sent to first chunk received
- ITL: milliseconds between each consecutive chunk (list, not aggregate)
- Output token count
- Total request duration
Output format: one JSON object per request.

## Component 5: Result Analyzer
Aggregate across all requests. Compute p50, p90, p99 for TTFT and ITL.
- FAIL if TTFT p99 exceeds [your TTFT SLA in ms]
- FAIL if ITL p99 exceeds [your ITL SLA in ms]
Output: JSON summary + per-request CSV.

## Constraints
- Max test duration: [N minutes]
- Error handling: log errors with timestamp and HTTP status code, exclude them from latency stats, report error rate separately
- Do NOT use benchmark_serving.py, benchmark_throughput.py, or GenAI-Perf — these are deprecated or phased out
- No hardcoded prompt lengths

## Validation Step
After generating the pipeline, run it single-user first. TTFT p99 should be within a narrow margin of the baseline from `vllm bench latency`. If it's significantly higher, the streaming handler or metric collector has a measurement error.
Ship It
You now have a decomposed pipeline — five components, each with defined inputs, outputs, and metric contracts. The traffic shape was always the spec. Now you have it written down, in a format an AI coding tool can actually use.
Run them in order: latency baseline, throughput ceiling, realistic multi-user profile. Every gap between those three numbers is specific information about your deployment.
AI-assisted content, human-reviewed. Images AI-generated. Editorial Standards · Our Editors