Instrument an AI Agent: LangSmith, Langfuse, OTel GenAI (2026)
Table of Contents
TL;DR
- An agent without spans is a black box. Decide what to trace before you pick the SDK.
- LangSmith, Langfuse, and OpenTelemetry GenAI cover three different bets — proprietary depth, OTel-native open source, and vendor-neutral standard. Pick on architecture, not on logos.
- Token usage, tool-call success, and span hierarchy are not optional metrics. If you can’t see them per run, you can’t debug the failures you haven’t seen yet.
It’s Monday morning. Your agent crashed at 3 a.m. The user got an apology email and a partial refund. The log file says tool_call_failed. That’s it. No inputs. No intermediate reasoning. No idea which of the seven steps in the run loop actually broke. You’re now reverse-engineering an incident from a one-line trace your framework wrote because nobody told it what to capture.
This is fixable. But not after the fact.
Before You Start
You’ll need:
- A working agent built on any framework — LangGraph, plain Python with tool-calling, custom orchestration, doesn’t matter
- A picture of Agent Observability as a layered concern: traces, metrics, and evaluations sit on top of well-shaped spans
- 30 minutes to read SDK docs before you write a single import statement
- A decision on whether you want vendor lock-in for depth, or vendor neutrality for portability
This guide teaches you: How to decompose an agent run into observable operations, specify what every span must carry, and choose the SDK that matches your architecture — not the one with the prettiest landing page.
The Agent That Worked in Demo and Lied in Production
You demoed the agent on Friday. It answered the test prompts perfectly. On Monday, three users hit a tool-call path your demo never exercised. The agent retried four times, hallucinated a function signature, and returned a confident wrong answer. Your support team has the user complaint. You have a stdout log with INFO: agent_run completed and nothing else.
The agent didn’t fail. Your observability did.
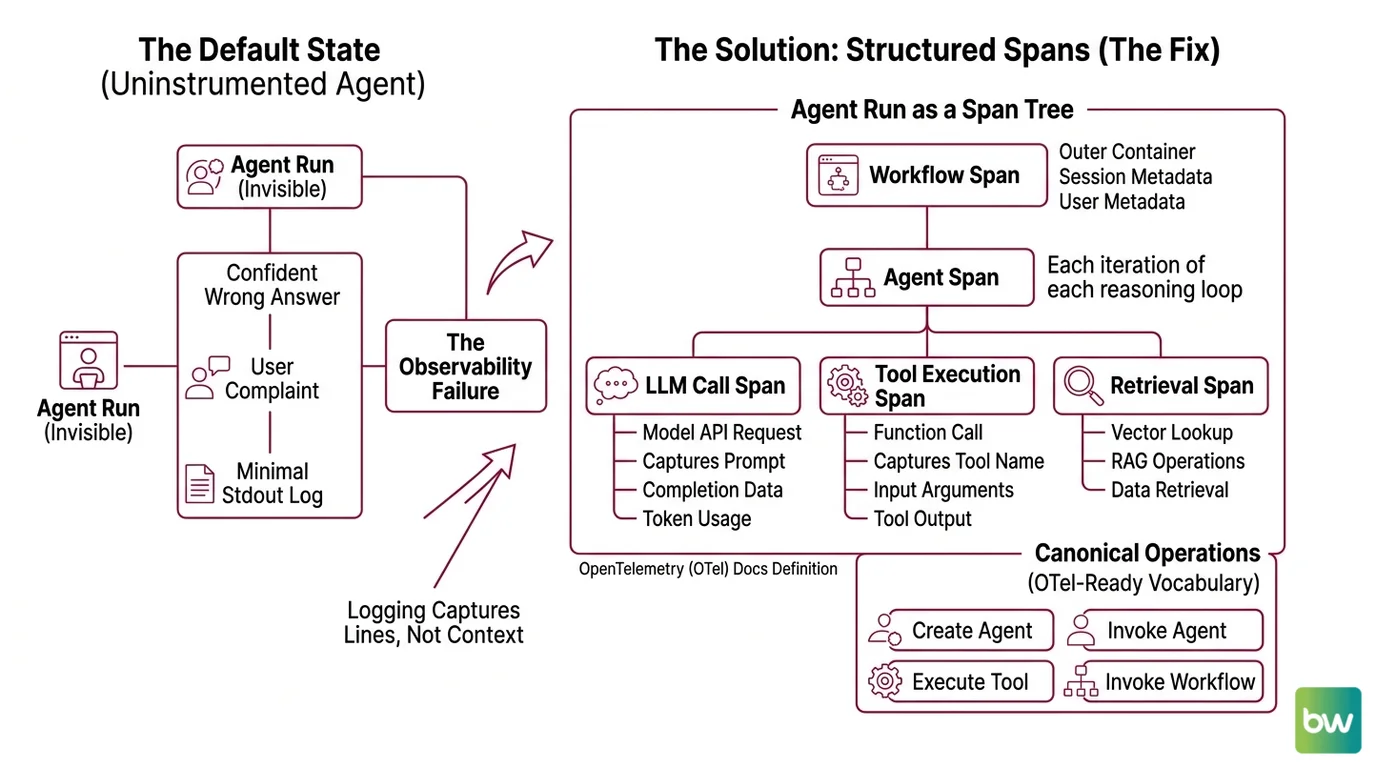
This is the default state of every uninstrumented agent: invisible until it embarrasses you. The fix is not “add logging.” Logging captures lines. You need spans — structured, nested, attributed records of every LLM call, every tool execution, every decision the agent made on the way to its answer.
Step 1: Decompose Your Agent into Observable Operations
Before you pick an SDK, name what a span is. An agent run is not one operation — it’s a tree.
A single agent invocation contains these observable parts:
- Workflow span — the outer container. Represents one end-to-end run triggered by a user request. Owns session and user metadata.
- Agent span — each iteration of the reasoning loop. May happen multiple times in one workflow if the agent calls itself recursively or delegates.
- LLM call span — every model API request. Captures prompt, completion, model name, token usage, finish reason.
- Tool execution span — every function the agent calls. Captures tool name, input arguments, output, latency, and whether it raised.
- Retrieval span — if the agent uses RAG, every vector lookup is its own span.
OpenTelemetry Docs (agent spans) define four canonical operations: create_agent, invoke_agent, execute_tool, and invoke_workflow. Use this vocabulary even if you’re not emitting OTel directly — it forces a clean decomposition and your team will thank you when they switch backends in eighteen months.
The Architect’s Rule: If you can’t draw the span tree on a whiteboard before you write any code, your agent is too tightly coupled to instrument. Refactor the orchestration first.
Step 2: Lock Down What Each Span Must Carry
The SDK will happily emit empty spans. That’s worse than nothing — you’ll get the illusion of observability without the data to debug. Specify what every span must record before you instrument the first function.
Context checklist — every span must capture:
- Identity: span name, parent span ID, trace ID
- Inputs: the actual prompt or tool arguments, not a sanitized stub
- Outputs: the model response or tool return value
- Token usage: input_tokens, output_tokens (and cached_tokens if your provider supports it)
- Model info: request.model, provider.name, response.finish_reasons
- Timing: start_time, end_time, duration_ms
- Status: success, error, error_type if applicable
- Business metadata: user_id, session_id, environment (prod/staging), agent version
OpenTelemetry Docs require two attributes on every agent span — gen_ai.operation.name and gen_ai.provider.name. Recommended attributes include gen_ai.agent.name, gen_ai.request.model, gen_ai.usage.input_tokens, and gen_ai.response.finish_reasons. These are the names every vendor that ingests OTel traces will recognize — Datadog, Grafana, and Honeycomb all align on this vocabulary.
One trap. Tool attributes do not live on agent spans. OpenTelemetry Docs (agent spans) specify that tool execution gets its own execute_tool span with its own attribute set. If you stuff tool metadata into the agent span you’re emitting non-standard data your dashboards won’t render.
The Spec Test: If your agent fails and the span data alone — no logs, no replay — can’t tell you which tool returned what at which step, your context spec is incomplete. Add the missing attribute now, not after the incident.
Step 3: Wire the SDK That Matches Your Architecture
Three credible choices. They are not interchangeable.
Build order for any of them:
- Top-level workflow function first — wrap your agent entrypoint with the SDK’s instrumentation primitive
- LLM client second — most SDKs auto-instrument OpenAI/Anthropic clients if you import them in the right order
- Tools and retrieval last — manually decorate each tool function so you get its inputs, outputs, and latency
Option A: LangSmith — proprietary depth for LangChain/LangGraph users
LangSmith’s instrumentation primitive is the @traceable decorator, documented by LangChain Docs. Stack it on any function and you get a nested run tree automatically — inputs, outputs, latency, and full nesting via Python contextvars. The Python SDK is at v0.8.3 (langsmith on PyPI), released earlier this month.
Pricing starts free on the Developer tier with 5,000 base traces a month and 14-day retention. The Plus tier is $39 per seat per month with 10,000 base traces included per organization (not per seat — this is the single most common pricing misread), then $2.50 per 1,000 additional traces (LangChain’s pricing page). Extended retention runs $5.00 per 1,000 traces with 400-day retention. Enterprise pricing is not publicly available.
Pick LangSmith if your agent is already on LangGraph and you want every node and edge auto-traced without writing decorators. The integration depth is the payoff. The cost is vendor lock-in — your span vocabulary becomes proprietary.
Option B: Langfuse — open-source, OTel-native, self-host or cloud
Langfuse v4.6.1 (langfuse on PyPI) shipped a few days ago. The instrumentation primitive is the @observe decorator, which auto-creates a trace for the top-level function and spans for every nested decorated function (Langfuse Docs). Both sync and async are supported.
The v3 SDK, generally available since June 5, 2025, was rewritten on top of OpenTelemetry — Langfuse emits OTLP spans natively, which means the same instrumentation works against any OTel-compatible backend (Langfuse Changelog). That’s the bet: write @observe once, swap backends without rewriting your code.
Cloud pricing starts free (50,000 units/month, 30-day retention) and scales to $29/month Core (Langfuse’s pricing page). Self-host is MIT-licensed and free as software, but the operational cost is real — you’ll need Postgres, ClickHouse, an object store, and Redis (Langfuse Self-Host Docs). “Free” on a screenshot is not free in production. Note that Langfuse was acquired by ClickHouse on January 16, 2026 along with a $400M Series D, with no announced changes to pricing or licensing.
Pick Langfuse if you want OTel portability without writing OTel boilerplate, and you can either run a small data platform yourself or pay for cloud.
Option C: OpenTelemetry GenAI semconv — vendor-neutral, standards-based
OTel GenAI semconv is a specification, not an SDK. It defines what GenAI spans should look like across every vendor. OpenTelemetry Docs mark the GenAI semantic conventions as still in “Development” status — they are experimental and attribute names will change before stabilization.
You instrument with any OTel-compatible SDK (the OpenTelemetry Python SDK, or auto-instrumentation libraries from OpenLLMetry/Traceloop), emit spans matching the semconv vocabulary, and ship them to whatever backend you want — Datadog, Grafana Tempo, Honeycomb, or Langfuse itself. Datadog added native support in OTel v1.37; Grafana ingests LLM traces into Loki (Dev|Journal).
Pick OTel GenAI semconv if vendor neutrality matters more than feature depth — for example, if you’re a platform team that supports multiple product teams and can’t pick a single proprietary backend.
Security & compatibility notes:
- Langfuse Python SDK v2 (legacy): v2 is no longer recommended; v3+ is OTel-based and not backward-compatible. v2 server endpoints have been deprecated since February 2024; SDKs below 2.0.0 have been broken since November 11, 2024 on cloud and any v3+ self-host. Action: migrate to v3 or v4 (Langfuse v2→v3 Upgrade Path).
- Langfuse v3 → v4 migration: v4 (rewritten March 2026) requires Pydantic v2 and introduces an observation-centric data model where user_id, session_id, metadata, and tags propagate to every observation. Action: audit Pydantic v1 dependencies before upgrading (Langfuse v3→v4 Upgrade Path).
- langchain-core below 1.2.4: token usage metadata and
.transform()/.atransform()inputs no longer surface correctly in LangSmith traces. Action: pin langchain-core ≥1.2.4 to keep cost and token metrics intact (LangSmith deprecation issue).- OTel
OTEL_SEMCONV_STABILITY_OPT_IN: default behavior keeps emitting legacy (≤v1.36.0) attribute names; settinggen_ai_latest_experimentaldiscontinues legacy and emits new names. Dashboards built on old names break on opt-in. Action: pin instrumentation library versions and migrate dashboards before flipping the env var (OpenTelemetry Docs).
Step 4: Verify You Can Actually Debug a Failure
Instrumentation that exists but doesn’t answer the questions you need is theater. Before you call this done, run the validation.
Validation checklist — pick one failed run and check:
- Can you find the run from a user complaint? — failure looks like: you have a user ID but no way to filter traces by it. Fix: propagate
user_idto every span (the Agent Evaluation And Testing layer relies on this). - Can you see the full span tree, in order, with timing? — failure looks like: spans appear but parent/child relationships are missing or out of order. Fix: your async instrumentation is dropping context — check how the SDK propagates contextvars across
awaitboundaries. - Can you see what each tool returned? — failure looks like: tool spans show duration but not output. Fix: tool outputs aren’t being captured (manual capture required in most SDKs).
- Can you compute token cost for a run? — failure looks like: input_tokens recorded, output_tokens missing. Fix: streaming responses often skip output token capture — check the SDK’s streaming handler.
- Can you replay a failed run? — failure looks like: you have the prompt but not the full system context the agent saw. Fix: capture the resolved system message, not just the user message.
- Can you trigger an alert when the failure rate spikes? — failure looks like: tool-call success rate is captured but not exported as a metric. Fix: derive a metric from the span data and ship it to your alerting system.
If any check fails, the gap is in your spec, not the SDK. Go back to Step 2 and add the missing attribute.
Common Pitfalls
| What You Did | Why AI Failed | The Fix |
|---|---|---|
| Wrapped only the top-level agent function | Inner LLM and tool calls show as one opaque span | Decorate every tool function and every LLM call manually |
Used print() and logger.info() for “observability” | Logs don’t carry parent/child relationships, can’t reconstruct span tree | Replace logs with structured spans that carry trace context |
| Stuffed tool metadata into the agent span | Non-standard attributes break OTel-compatible dashboards | Tools get their own execute_tool span per the semconv |
| Skipped user/session ID propagation | You can’t find the trace from a user complaint | Add user_id and session_id as resource attributes on the workflow span |
| Trusted streaming-response token counts by default | Most SDKs skip output_tokens on streamed completions | Implement streaming-aware token capture or aggregate post-stream |
| Picked SDK by tutorial quality | Locked into a backend whose pricing model doesn’t match your scale | Pick by span model and pricing curve at your projected volume |
Pro Tip
Instrumentation outlives architecture. The agent you ship today will be rewritten in eighteen months — different framework, different LLM, different orchestration. The spans will survive. So design your span vocabulary as a contract between your runtime and your debugging future. Use the OpenTelemetry GenAI names even if your current backend is proprietary. Use semantic attributes even when the SDK accepts free-form strings. The day you swap LangSmith for Langfuse, or Langfuse for a future tool that doesn’t exist yet, the dashboards keep working because the spans speak a shared language.
Frequently Asked Questions
Q: How to instrument an AI agent for tracing and monitoring step by step?
A: Decompose the run into spans (workflow → agent → LLM/tool/retrieval), specify the attributes each span must carry, then wrap your code with the SDK primitive — @traceable for LangSmith or @observe for Langfuse — starting from the entrypoint and working inward. Watch out for async context loss across await boundaries — that’s where parent/child relationships silently break in most SDKs.
Q: How to debug a failing multi-step agent using span hierarchies and replay?
A: Filter by trace ID or user ID, walk the span tree top-down, and check the input/output pair on every span until you find the divergence. The trick is capturing the full resolved system message (not just the user prompt) on the LLM span — without it, replay is impossible because you can’t reconstruct what the agent actually saw at decision time.
Q: How to track token usage, latency, and tool-call success rates per agent run?
A: Record gen_ai.usage.input_tokens and gen_ai.usage.output_tokens on every LLM span, capture span duration via start/end timestamps, and emit a status field on tool spans. Then derive per-run metrics from the span aggregate. Streaming responses are the common gap — output tokens are easy to miss on streamed completions unless you wire a stream-aware token counter explicitly.
Your Spec Artifact
By the end of this guide, you should have:
- A span map — the four-layer decomposition (workflow → agent → LLM/tool/retrieval) drawn against your specific agent’s run loop
- A span attribute contract — the required and recommended attributes every span type must carry, aligned to the OpenTelemetry GenAI vocabulary
- A validation checklist — six debug-readiness questions you can answer with span data alone, no logs required
- An SDK decision rationale — written justification for LangSmith, Langfuse, or OTel based on your team’s architecture, not on tutorial popularity
Your Implementation Prompt
Drop this into Claude Code, Cursor, or Codex to scaffold instrumentation against your existing agent. Fill the bracketed placeholders with values from your codebase before you submit.
You are instrumenting an AI agent for production observability. Apply the following four-step framework to the agent code in [path/to/agent/module].

STEP 1 — Decompose into spans:
- Workflow span owns user_id=[your user identifier source] and session_id=[your session source]
- Agent span wraps each iteration of [your agent loop function name]
- LLM call span wraps every call to [your LLM client, e.g., openai.chat.completions.create]
- Tool execution span wraps each function in [your tool registry location]
- Retrieval span wraps [your vector store query function, or "skip if no RAG"]

STEP 2 — Required span attributes:
- gen_ai.operation.name on every span (workflow, agent, llm, tool, retrieval)
- gen_ai.provider.name = "[your LLM provider]"
- gen_ai.request.model = [your model name source, e.g., env var or config field]
- gen_ai.usage.input_tokens and gen_ai.usage.output_tokens on every LLM span
- gen_ai.response.finish_reasons on every LLM span
- error.type and status on any span that may raise
- user_id, session_id, environment="[prod|staging]" on the workflow span

STEP 3 — Build order:
1. Wrap the agent entrypoint function with [SDK primitive: @traceable or @observe]
2. Auto-instrument the LLM client by importing [SDK import path] before the LLM SDK
3. Manually decorate each function in the tool registry — capture inputs as args and outputs as return value
4. If RAG is used, wrap the vector query function with retrieval span attributes

STEP 4 — Validate debugging capability:
- Run one synthetic failure (force a tool to raise) and confirm the failed span shows error.type
- Filter the trace by user_id and confirm you can find it from a user identifier alone
- Confirm the span tree shows parent/child relationships across all async boundaries
- Confirm token usage is recorded on streamed responses (this is the common gap)

Output: the modified agent module with instrumentation applied, plus a short note listing any span attributes you could not populate and why.
Ship It
You no longer have an agent. You have a system with observable operations, span attributes specified by contract, and a debugging path that works from a user ID. The next failure won’t surprise you — you’ll have spans before you have a complaint.
AI-assisted content, human-reviewed. Images AI-generated. Editorial Standards · Our Editors