How to Instrument a Production LLM App with Langfuse and LangSmith Step by Step in 2026
TL;DR
- Define your observability surface before touching any SDK — trace boundaries, cost attribution needs, and user identity are the three contracts your instrumentation must fulfill.
- Langfuse (MIT, self-hostable, OpenTelemetry-native) and LangSmith (proprietary, deep LangChain/LangGraph integration) cover different failure modes. The choice isn’t quality — it’s control vs. native wiring.
- Every component you instrument needs four things specified: what it receives, what it returns, what it must not do, and how failures surface. Miss one and the AI coding tool generates a happy-path stub.
Your LLM app shipped. Traffic is up. Then one morning you get a message: “the AI is giving weird answers.” You open your logs. No LLM call records. No inputs. No outputs. No latency data. No way to tell whether the model changed behavior, the retrieval broke, or a prompt template drifted between deployments. You are debugging by user report.
That is the production incident nobody talks about until they’re in it. And the fix isn’t adding a logging statement after the incident — it’s specifying the observability layer before it.
This guide teaches you how to decompose a production LLM application into observable units and write instrumentation contracts that your AI coding tool (Cursor, Claude Code, or similar) can implement correctly on the first attempt.
Before You Start
You’ll need:
- An AI coding tool: Cursor, Claude Code, or similar
- A working grasp of LLM Observability — what traces, spans, and generations mean in an LLM pipeline
- A target application that calls an LLM (raw SDK, LangChain, LangGraph, or any OpenTelemetry-compatible library)
- Access to Langfuse Cloud or a LangSmith account
This guide teaches you: How to map the observability surface of your LLM app, specify the SDK contracts your AI coding tool needs to generate, and validate that the instrumentation captures what actually matters — before you need it.
The Instrumentation That Fooled Everyone
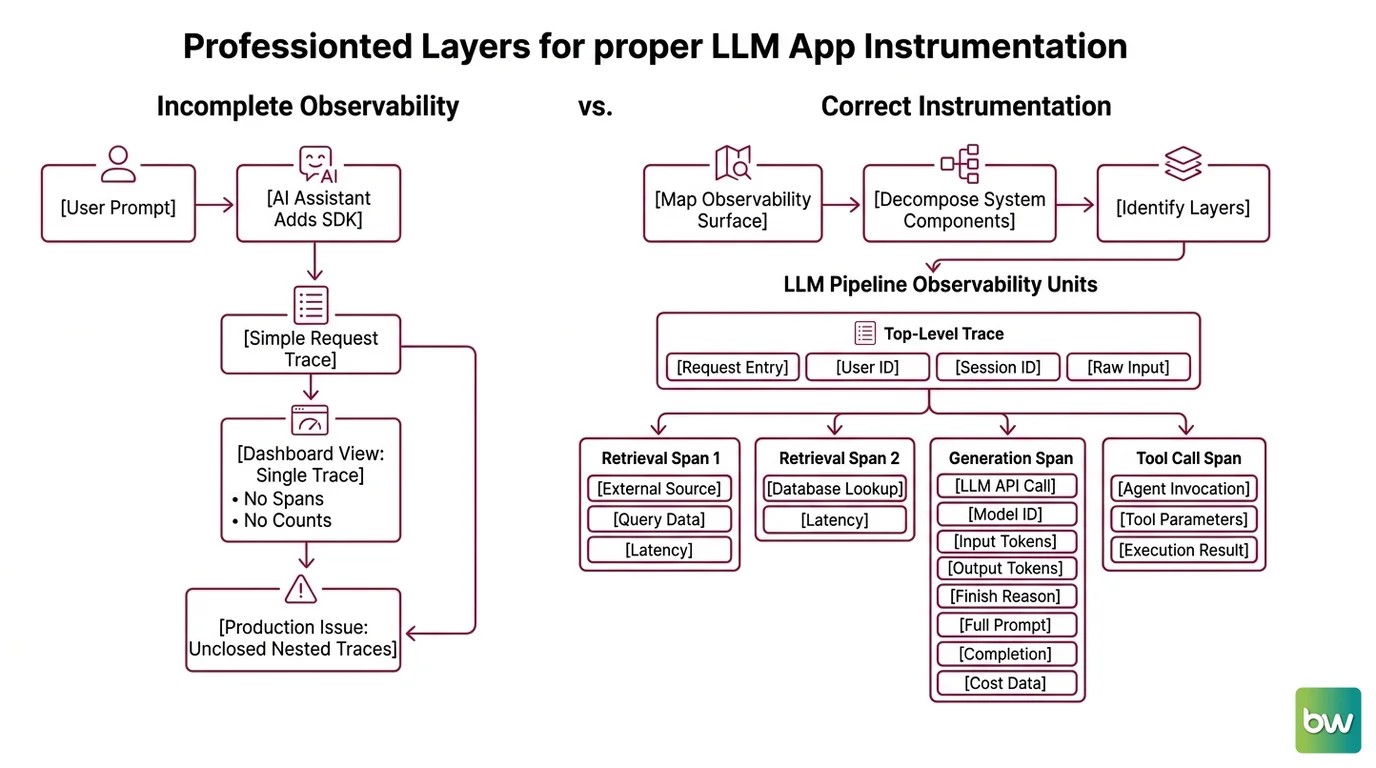
Here is what incomplete observability specification looks like in practice. You prompt your AI coding assistant: “add Langfuse to the app.” It adds the SDK import, sets the API key, calls trace.update() once at the start of the request handler. Your dashboard shows one trace per request. No generation spans. No token counts. No retrieval calls. No cost data.
The AI did exactly what you asked. You asked for the wrong thing.
It passed local testing. In production, the first retry loop created nested traces the parent never closed — because span boundaries were never specified, only “add the SDK.”
Step 1: Map Your Observability Surface
You cannot instrument what you haven’t decomposed. Before touching SDK code, map the components of your LLM pipeline that need visibility. Every production LLM app has the same structural layers.
Entry point — the boundary where a user request enters your system. This is the top-level trace. It must carry user identity, session context, and the raw input. Everything else is a child.
Retrieval layer — each retrieval call is a child span. Latency here explains a large share of quality problems. If you use Distributed Tracing patterns in your existing infrastructure, this maps directly. Vector search, database lookups, context assembly — each is a separate observation.
Generation layer — the actual LLM API call. This is where token counts live, where model metadata lives, where cost is attributed. Every generation span needs: model ID, input tokens, output tokens, finish reason, and the full prompt and completion.
Tool call layer — if your app uses agents, each tool invocation is its own span. Miss these and you cannot tell whether an agent failure happened at reasoning or at execution.
Your system has these observability units:
- Top-level trace — request entry, user ID, session ID, raw input
- Retrieval spans — one per external data source queried
- Generation spans — one per LLM API call, with full token and cost metadata
- Tool call spans — one per external tool invoked by an agent node
- Error spans — any exception that terminates a branch of the pipeline
The Architect’s Rule: If you cannot name every LLM call and every retrieval call that fires for a single user request, the AI coding tool cannot instrument them either. Walk one request through the system manually before writing the spec.
Step 2: Specify the Tool Contract
The choice between Langfuse and LangSmith is not a quality comparison. Both are production-ready in 2026. It is a question of which failure modes you need to cover and what control you need over your data.
Langfuse is OpenTelemetry-native. Its Python SDK (4.12.0, requiring Python 3.10+, per Langfuse PyPI) and JS/TS SDK (v5, current stable) are thin wrappers over OTel clients. Any library that emits OTel spans automatically appears in Langfuse traces. Self-hosting is free under the MIT license via Docker Compose or Kubernetes — a model that remained unchanged after Langfuse’s acquisition by ClickHouse in January 2026 (Langfuse Blog). If your LLM app uses multiple providers, custom chains, or any non-LangChain orchestration, Langfuse’s framework-agnostic approach is the lower-friction path.
LangSmith is the native observability layer for LangChain and LangGraph stacks. If your app uses LangGraph agents, LangSmith’s automatic tracing captures the full node execution graph, including retry counts and state transitions at each step — depth that a generic OTel integration cannot match. The tradeoff: LangSmith is proprietary SaaS. The Developer plan is free at 5k traces/month (LangChain Pricing). Self-hosting is Enterprise-only with no self-serve path.
Your tool selection checklist:
- Framework: LangChain/LangGraph stack → LangSmith. Any other orchestration or mixed providers → Langfuse.
- Data residency: VPC-locked, no cloud egress → Langfuse self-host (free, MIT). Cloud acceptable → either.
- Budget: LangSmith Developer (5k traces/month free, LangChain Pricing) covers prototype scale. Langfuse Hobby (50k units/month free, Langfuse Pricing) handles higher-volume experimentation without an account upgrade.
- Existing infrastructure: if your org already runs distributed tracing infrastructure → Langfuse OTel-native path connects directly.
The Spec Test: If your spec doesn’t name the SDK version, the AI coding tool defaults to whatever is in its training data. For Langfuse Python, that may be v3 — which has different method names than v4. Specify the version. Not in a comment. In the spec.
Step 3: Wire SDK Entry Points to Trace Boundaries
You have the surface map. You have the tool. Now specify the instrumentation contracts so your AI coding tool can wire them without guessing.
For each component from Step 1, your context spec must state:
- What it receives — input schema, type, relevant identifiers
- What it returns — output schema, what constitutes a completed span
- What it must not do — don’t swallow exceptions, don’t log PII fields, don’t block the request path with synchronous flushing
- How failures surface — catch, tag the span as error with the exception message, re-raise
Prompt Logging scope: Specify which fields get captured. In regulated environments, user messages may contain sensitive data. Default instrumentation logs everything. Your spec must name a sanitization step if full logging is not acceptable.
Build order:
- Top-level trace first — no child spans can attach until the parent exists
- Retrieval spans next — most production latency problems live here
- Generation spans — attach token counts and model metadata at creation, not in a post-call callback
- Tool call spans last — these depend on the framework’s tool invocation hook pattern
For LangSmith with LangChain stacks, your spec needs LANGCHAIN_TRACING_V2=true and the API key — the framework handles span creation automatically. You must still specify langchain-core>=1.2.4 explicitly; older versions silently drop token count data from LangSmith traces (LangChain GitHub). Silent data loss is the worst kind: the traces appear, but every cost and token field shows null.
For Langfuse Python, your spec must identify each function-level entry point where a trace or observation starts. The Python SDK v4 uses start_observation() — not start_span() or start_generation(), which were the v3 method names (Langfuse Docs). An AI coding assistant trained before March 2026 generates broken wiring unless your spec pins the API version and names the current method.
Security & compatibility notes:
- Langfuse Python SDK v4 (March 2026): Breaking changes from v3 —
start_span()andstart_generation()renamed tostart_observation(), API namespace remapped, Smart Default Span Filtering added (not all spans are exported by default). Migration guide: langfuse.com/docs/observability/sdk/upgrade-path/python-v3-to-v4.- Langfuse JS/TS SDK v5: Breaking changes from v4. Pin to v5 (current stable). Migration guide: langfuse.com/docs/observability/sdk/upgrade-path/js-v4-to-v5.
- LangSmith SSRF (CVE-2026-25528): Critical vulnerability — a malicious
baggagetracing header routes trace data to attacker-controlled endpoints, exposing LLM inputs and outputs. Fix: Pin langsmith Python SDK ≥0.6.3, JS SDK ≥0.4.6 (GitHub Advisory).- LangChain token counts: langchain-core <1.2.4 silently drops token metadata from LangSmith traces. Pin langchain-core ≥1.2.4 (LangChain GitHub).
Step 4: Validate That You’re Capturing What Matters
Instrumentation that doesn’t surface in your dashboard is the same as no instrumentation. These checks prove the wiring is complete. Run them against a single test request before trusting anything in production.
Validation checklist:
- Every LLM call produces a generation span — failure looks like: request completes but no new span in the trace tree
- Token counts appear on every generation span — failure looks like: generation span exists but cost and token fields show null or zero
- User ID attaches to every top-level trace — failure looks like: traces present, user field empty; you cannot debug per-user regressions
- Retrieval calls appear as child spans under the top-level trace — failure looks like: flat traces with one span, no retrieval latency data visible
- Error paths produce error-tagged spans — failure looks like: an exception fires in your logs but no error span appears in the trace tree; the pipeline silently swallowed it
Count the spans. Verify the token data. Check the user ID field. If any field is missing, the specification didn’t define it — not the SDK. Go back to Step 1 and name the missing unit. Then regenerate the instrumentation.
Common Pitfalls
| What You Did | Why the AI Generated Broken Instrumentation | The Fix |
|---|---|---|
| Asked for “add Langfuse to the app” | Too broad — AI instruments one entry point and stops | Specify every trace boundary with entry and exit contracts |
| No SDK version in spec | AI defaults to training-data version (may be Langfuse v3) | Pin explicitly: langfuse>=4.12.0 (Python) / langfuse@v5 (JS) |
| Skipped token count spec | AI generates generation spans without token metadata | Add “capture input_tokens, output_tokens, total_tokens on every generation span” |
| No user ID in spec | AI instruments the pipeline, not the user journey | Add “attach user_id from request context to the top-level trace” |
| No error-path spec | AI instruments happy path only; exceptions silently drop spans | Add “on exception: catch, tag span as error with exception message, re-raise” |
Pro Tip
The observability spec is your contract with the future. Instrumentation code is the most likely thing to break silently when you change your pipeline — a new retrieval source, a new model, a new agent node. Write the spec as a document, not just a prompt. When you update the pipeline, update the spec first. Then give the updated spec to your AI coding tool. The delta between old spec and new spec is the instrumentation change. This pattern works across provider swaps, framework upgrades, and team handoffs.
Frequently Asked Questions
Q: How to add LLM observability to a production app with Langfuse step by step?
A: Install langfuse>=4.12.0 (Python 3.10+) or langfuse@v5 (JS). Set LANGFUSE_PUBLIC_KEY, LANGFUSE_SECRET_KEY, and LANGFUSE_HOST from environment variables. Wrap each LLM call boundary with start_observation() — the v4 Python SDK method, which replaced start_span() and start_generation() from v3. The gap most implementations miss: token counts require explicit metadata passed to the generation observation. They do not appear automatically. The Langfuse SDK overview covers the full attribute list.
Q: How to use LangSmith to debug LangChain and LangGraph agent failures?
A: Set LANGCHAIN_TRACING_V2=true and LANGSMITH_API_KEY — LangGraph and LangChain auto-instrument from there. For agent failures specifically, open the trace in LangSmith and use node-level replay: select the failed agent node and re-run it against modified inputs without executing the full graph. This isolates whether the failure is in the node’s prompt, its tool selection, or the state it received from the previous node. Requires langchain-core>=1.2.4 for token counts to appear.
Q: When should you self-host Langfuse instead of using a managed LLM observability platform? A: Self-host Langfuse when data must stay in your VPC with no cloud egress, when trace volume makes Cloud overage costs exceed hosting costs, or when you need audit controls beyond what Langfuse’s Cloud tiers offer. Langfuse self-hosting is free under the MIT license via Docker Compose or Kubernetes, unchanged since the ClickHouse acquisition (Langfuse Self-Host Pricing). LangSmith self-hosting is available only on Enterprise contracts — no self-serve path. If open-source and in-VPC are requirements, Langfuse is the only option between the two.
Your Spec Artifact
By the end of this guide, you should have:
- An observability surface map — every LLM call, retrieval call, and tool call in your pipeline named, bounded, and assigned to a span type
- A tool selection decision — Langfuse or LangSmith — tied to your stack, data residency requirements, and framework integration needs
- An instrumentation contract for each component — input, output, constraints, error handling, and the specific metadata fields required on each span type
Your Implementation Prompt
Drop this into Claude Code, Cursor, or your AI coding tool. Fill in each bracket with values from your surface map (Step 1) and tool contract (Step 2) before handing it over.
You are adding LLM observability instrumentation to a production application.

Tool: [Langfuse / LangSmith — choose one]
SDK version: [langfuse>=4.12.0 (Python) | langfuse@v5 (JS) | langsmith>=0.6.3 (Python) | langsmith>=0.4.6 (JS)]
Framework: [raw OpenAI SDK / LangChain / LangGraph / custom]

Observability surface:
- Top-level trace: entry at [function or route name], must capture user_id=[field path], session_id=[field path], raw input=[field path]
- Retrieval spans: one span per [list retrieval functions], capture: query text, result count, latency
- Generation spans: one per [list LLM call sites], capture: model=[model id], input_tokens, output_tokens, total_tokens, finish_reason, full prompt, full completion
- Tool call spans: [list agent tool functions, or "none"]

Constraints:
- Do not log: [PII field names — e.g., email, phone, user_name]
- Error handling: on exception, tag span as error with exception message and re-raise — do not swallow
- Auth: read all credentials from environment variables only — never hardcode keys

Security pins (include in requirements):
- If using langsmith: >=0.6.3 (Python) / >=0.4.6 (JS) — CVE-2026-25528 patch
- If using langchain-core: >=1.2.4 — required for token count data in LangSmith

Validation criteria:
- A test request produces a top-level trace with correct user_id visible in dashboard
- Every LLM call produces a generation span with non-null input_tokens and output_tokens
- Retrieval functions produce child spans nested under the top-level trace
- Exceptions produce error-tagged spans — not silent completions

Instrument only the observability layer. Do not modify application logic, prompt content, or business rules.
Ship It
You now have a decomposition pattern that survives model swaps, framework upgrades, and team changes. The spec is the asset — not the generated code. Every time your pipeline changes, update the surface map first, update the implementation prompt second, generate the new instrumentation third. That sequence keeps your observability layer accurate without a rewrite.
AI-assisted content, human-reviewed. Images AI-generated. Editorial Standards · Our Editors