How to Calculate and Tune Precision, Recall, and F1 Score with scikit-learn and TorchMetrics in 2026
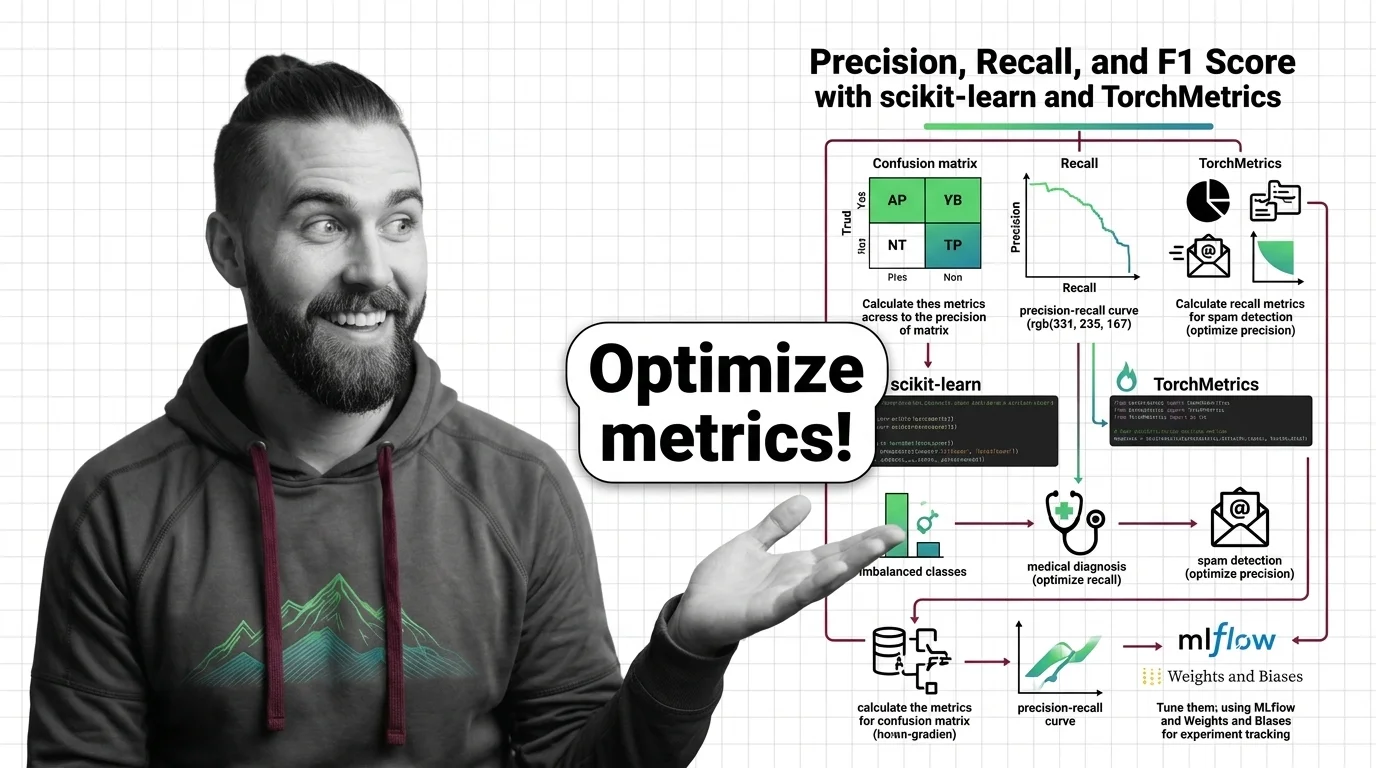
Table of Contents
TL;DR
- Accuracy hides failures on rare classes — precision, recall, and F1 expose what accuracy buries
- Your averaging strategy (macro, micro, weighted) changes the story your metrics tell about the same model
- Specify the metric stack before training, not after the first bad deployment
Your model passed every accuracy check. You shipped it. Two weeks later, the fraud team called — the model caught none of the fraudulent transactions. Every one slipped through. The accuracy was real. The metric was wrong for the job.
Before You Start
You’ll need:
- An AI coding tool (Claude Code, Cursor, or Codex)
- A classification dataset with labeled ground truth
- Familiarity with Confusion Matrix outputs and what each cell represents
This guide teaches you: how to decompose your Model Evaluation pipeline into the right metric stack, specify averaging strategies for your class distribution, and validate that your Classification Threshold serves the use case — not just the dashboard.
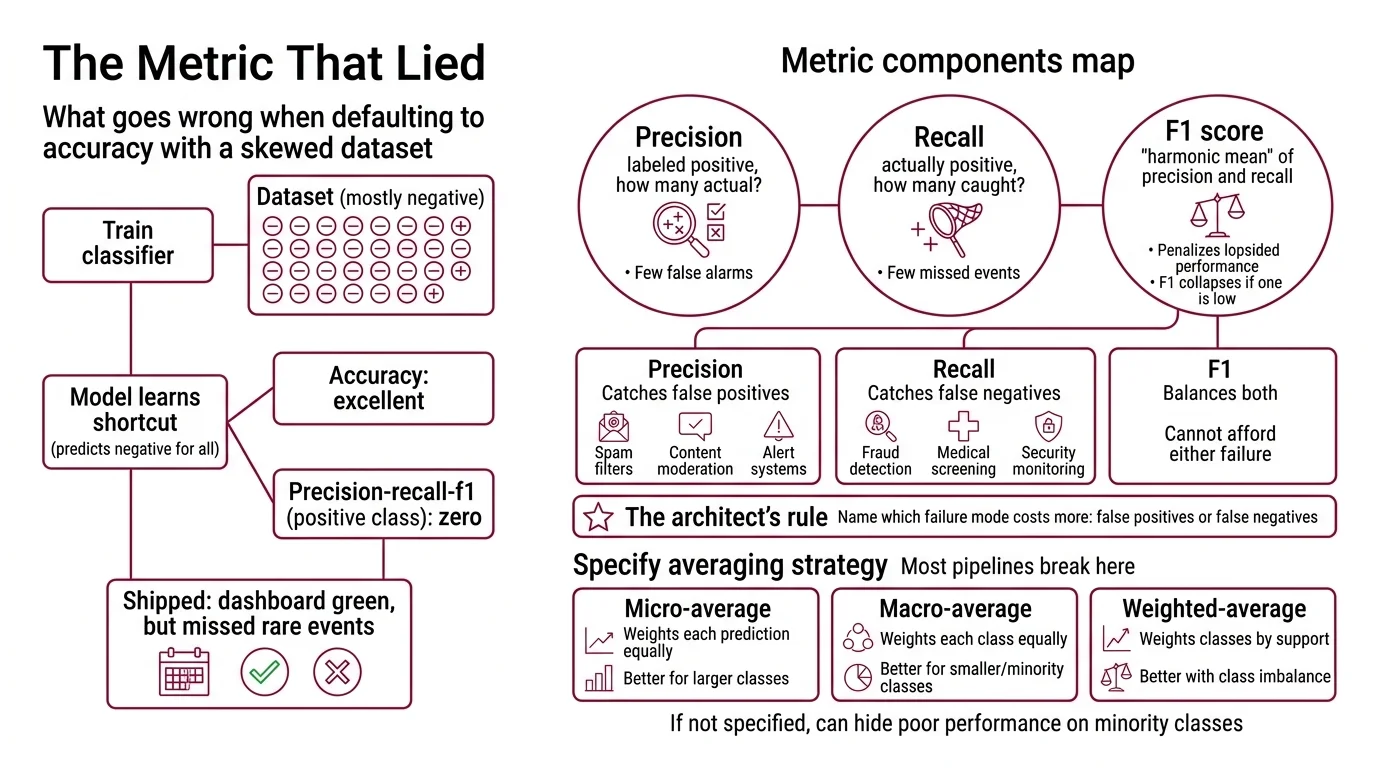
The Metric That Lied
Here is what goes wrong when you default to accuracy.
You train a classifier on a dataset where the vast majority of samples are negative. The model learns a shortcut: predict “negative” for everything. Accuracy looks excellent. Precision, Recall, and F1 Score on the positive class: flat zeros across the board.
It shipped on Thursday. By Monday, the support queue had answers — none of the rare-class events were being caught, and the dashboard glowed green because nobody specified which metric mattered for which class.
Step 1: Map Your Metric Components
Three numbers. That is your starting kit.
Precision answers one question: of all the items you labeled positive, how many actually were? High precision means few false alarms.
Recall — also called True Positive Rate — answers the opposite: of all the items that were actually positive, how many did you catch? High recall means few missed events.
F1 score is the Harmonic Mean of precision and recall. It penalizes lopsided performance harder than a straight average would. A model with near-perfect precision and negligible recall gets an F1 that collapses — not a comfortable midpoint, but a number that screams something is wrong.
Your metric map has these parts:
- Precision — catches false positives. Critical for spam filters, content moderation, alert systems where false alarms erode trust.
- Recall — catches false negatives. Critical for fraud detection, medical screening, security monitoring where missed events cost lives or money.
- F1 — balances both. Use when you cannot afford to ignore either failure mode.
The Architect’s Rule: If you cannot name which failure mode costs more — false positives or false negatives — you are not ready to pick a metric.
Step 2: Specify Your Averaging Strategy
This is where most evaluation pipelines break. You have multiple classes. You need a single number. The average parameter decides what story that number tells — and the default is almost never what you want.
Macro average computes the metric independently for each class, then takes the unweighted mean. Every class counts equally, regardless of size. A class with a handful of samples gets the same weight as a class with thousands.
Micro average pools all true positives, false positives, and false negatives across classes, then computes a global metric. Dominated by the majority class. Useful when every individual prediction matters equally.
Weighted average works like macro, but weights each class by its support count. Accounts for Class Imbalance without ignoring minority classes entirely.
Your context checklist:
- Number of classes and their distribution specified
- Business cost of false positives vs. false negatives per class documented
- Averaging strategy chosen and justified — not defaulted
- Threshold for “acceptable” F1 per class defined before training starts
- Whether minority class performance is a deployment gate decided upfront
The Spec Test: If your evaluation spec says
average='weighted'but your deployment concern is a rare class with minimal prevalence, you just buried the signal under the majority. Switch to macro or evaluate per-class.
Step 3: Wire Metrics Into Your Evaluation Pipeline
Two paths. Choose based on your stack.
scikit-learn path — batch evaluation after training. The classification_report function returns per-class precision, recall, F1, and support in a single call (scikit-learn Docs). Pass output_dict=True and you get a dictionary you can log directly. scikit-learn 1.8.0 added Array API support for GPU computing, which means your metric computation can run on the same device as your model.
TorchMetrics path — live evaluation during training. F1Score(task="multiclass", num_classes=N, average="macro") computes F1 on every batch (TorchMetrics Docs). TorchMetrics 1.9.0 ships over a hundred metrics, all GPU-native.
Build order:
- Per-class metrics first — this is where problems surface. Run
classification_reportor per-class TorchMetrics. Read the numbers class by class. Do not skip to the aggregate. - Aggregate metrics second — the aggregate only makes sense after you confirm per-class health. Choose your averaging strategy based on Step 2.
- Complementary metrics last — Roc Auc for threshold-independent ranking, Matthews Correlation Coefficient for a balanced score even on extreme imbalance. These are safety nets, not replacements for F1.
For each metric in your pipeline, specify:
- What it receives (predictions + labels, probabilities or hard labels)
- What it returns (scalar, per-class dictionary, or both)
- What it must NOT do (silently aggregate over broken classes)
- How to handle failure (alert if any per-class F1 drops below your threshold)
Step 4: Validate Your Threshold Decisions
Your model outputs probabilities. The threshold turns them into predictions. Default is 0.5. Default is almost never right.
Validation checklist:
- Per-class F1 at default threshold computed — failure looks like: one class has F1 near the floor while others score well
- Precision-recall curve plotted per class — failure looks like: the curve collapses early, meaning no threshold gives acceptable recall without destroying precision
- Threshold selected per use case — failure looks like: same threshold applied to fraud detection (recall-critical) and spam filtering (precision-critical) because nobody specified the difference
- Results logged to experiment tracker — failure looks like: you tuned a threshold last week and cannot reproduce the number because it lived in a notebook cell you overwrote
Common Pitfalls
| What You Did | Why It Failed | The Fix |
|---|---|---|
| Used accuracy on imbalanced data | Majority class inflated the number | Switch to per-class F1 with macro average |
Defaulted to average='micro' | Minority class performance vanished in the aggregate | Use macro or evaluate per-class before aggregating |
| Tuned threshold in a notebook | Cannot reproduce the deployed threshold | Log every threshold experiment with step parameter |
| Reported F1 without naming the average | Stakeholder assumed per-class; you reported weighted | Always state the averaging strategy next to the number |
| Skipped Benchmark Contamination checks | Test data leaked into training, metrics looked perfect | Audit your split before celebrating |
Pro Tip
Metrics are a specification problem, not a math problem. The formulas are settled. The hard part is specifying which failure mode matters before you see the results — because once you see the results, every choice feels obvious in hindsight. Write your metric spec before training. Include: which metric, which averaging strategy, which threshold, which per-class minimum. Treat it like a test contract. If the model does not pass, it does not ship.
Frequently Asked Questions
Q: How to calculate precision recall and F1 score in Python with scikit-learn classification report?
A: Call classification_report(y_true, y_pred, output_dict=True) to get per-class precision, recall, F1, and support as a dictionary. For a single F1 scalar, use f1_score with your chosen average mode. Always set output_dict=True so results stay programmatic — parsing printed tables breaks downstream logging.
Q: How to choose between optimizing precision vs recall for spam detection vs medical diagnosis? A: Name the costlier failure mode. Spam detection penalizes false positives harder — a real email in spam erodes trust. Medical screening penalizes false negatives — a missed condition delays treatment. Once the cost asymmetry is documented, the metric choice follows directly from the spec.
Q: How to use F1 score for multiclass classification with imbalanced classes in 2026?
A: Use macro-averaged F1 when every class matters equally regardless of size. Use weighted when the aggregate should reflect class frequencies. Either way, inspect per-class F1 first — the aggregate can mask a failing class. scikit-learn 1.8.0 supports all three averaging modes via the average parameter (scikit-learn Docs).
Q: How to track precision recall and F1 across experiments in MLflow and Weights and Biases?
A: MLflow: mlflow.log_metrics({"f1": val, "precision": val}, step=epoch) — free, open-source under Apache 2.0 (MLflow Docs). W&B: wandb.log() with interactive dashboards; Teams plan starts at $50/user/month, personal use is free (W&B Pricing). Log per-class metrics alongside aggregates.
Your Spec Artifact
By the end of this guide, you should have:
- A metric map — precision, recall, F1 per class, with the averaging strategy justified for your use case
- A threshold specification — per-class thresholds tied to business failure costs, not defaults
- A validation gate — minimum per-class F1 that must pass before deployment, logged in your experiment tracker
Your Implementation Prompt
Paste this into Claude Code, Cursor, or your AI coding tool. Fill in the bracketed placeholders with your specific constraints from Steps 1 through 4.
Build an evaluation pipeline for a [multiclass/binary] classifier with the following specification:

METRIC STACK (Step 1):
- Compute per-class precision, recall, and F1 score
- Compute aggregate F1 using [macro/micro/weighted] averaging
- Include ROC-AUC and Matthews Correlation Coefficient as secondary metrics

CLASS DISTRIBUTION (Step 2):
- Number of classes: [N]
- Class names and approximate proportions: [class_a: X%, class_b: Y%, ...]
- The critical class is [class_name] — optimize for [precision/recall] on this class
- Minimum acceptable per-class F1: [threshold, e.g., 0.5]

EVALUATION FRAMEWORK (Step 3):
- Use [scikit-learn 1.8 / TorchMetrics 1.9] for metric computation
- Return classification_report as output_dict for programmatic access
- Log all metrics to [MLflow / Weights & Biases] with step parameter for epoch tracking

THRESHOLD VALIDATION (Step 4):
- Plot precision-recall curves per class
- Evaluate F1 at thresholds [0.3, 0.4, 0.5, 0.6, 0.7] for the critical class
- Select threshold that maximizes [precision/recall/F1] for [class_name]
- Log the selected threshold and its per-class metrics to the experiment tracker

CONSTRAINTS:
- Python version: [3.11/3.12/3.13/3.14]
- Do not silently aggregate — always compute per-class before aggregate
- Fail if any per-class F1 falls below [minimum threshold] on the validation set
- Output: evaluation report dictionary and logged experiment run
Ship It
You now have a decomposition framework for classification metrics that separates the math from the decision. The formulas have not changed. What changed is that you specified which failures matter before the model trained — and that specification is what separates a dashboard that shows green from one that tells the truth.
AI-assisted content, human-reviewed. Images AI-generated. Editorial Standards · Our Editors