How to Build and Visualize Confusion Matrices with scikit-learn, TorchMetrics, and Weights & Biases in 2026
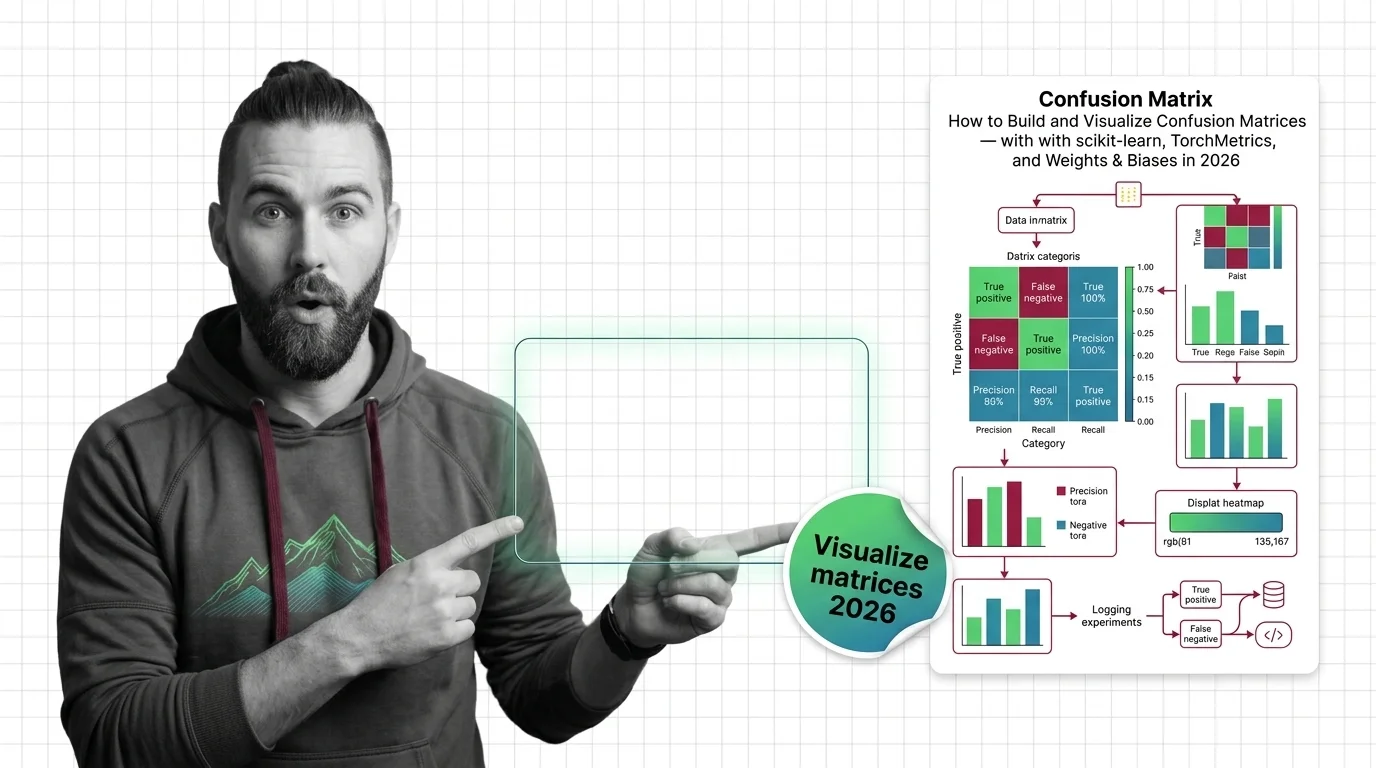
Table of Contents
TL;DR
- A confusion matrix exposes what accuracy hides — specify one before you trust any classifier
- scikit-learn 1.8, TorchMetrics 1.9, and W&B 0.25 each handle matrices differently — match the tool to your workflow
- Log every matrix to an experiment tracker so you compare across runs, not just stare at one
Your classifier reports 98% accuracy. Looks great on the dashboard. Ships to production. Then the first week’s report lands: the model missed every single fraud transaction. One Confusion Matrix would have caught it before deployment — the entire “fraud” row was zeros. The accuracy number was real. The model was useless.
Before You Start
You’ll need:
- An AI coding tool (Claude Code, Cursor, or Codex)
- A trained classifier with predictions and ground-truth labels ready
- Familiarity with Binary Classification and Precision, Recall, and F1 Score
This guide teaches you: how to decompose a confusion matrix pipeline into specification layers — from raw predictions to tracked, comparable visualizations — so your AI tool builds evaluation code that actually reveals what your model gets wrong.
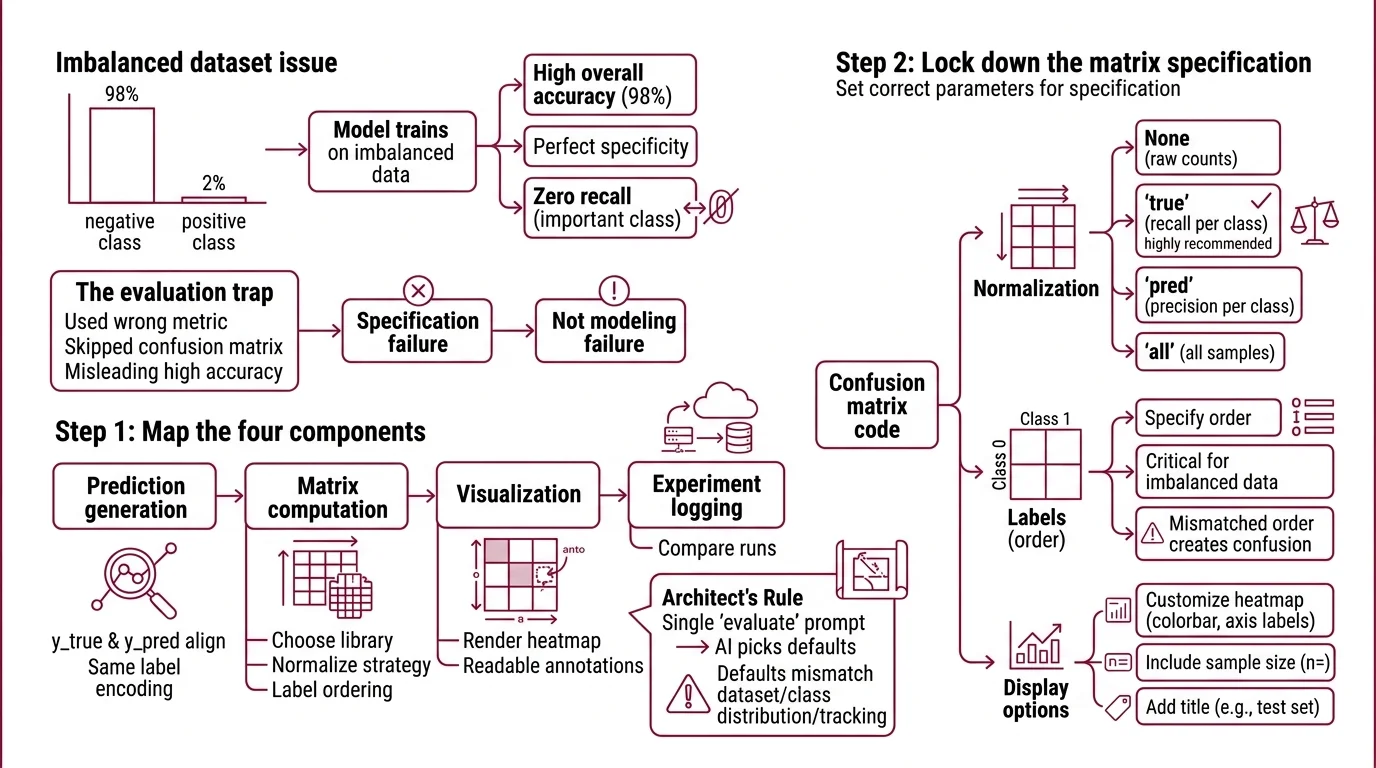
The Accuracy Number That Lied
Here’s what goes wrong. You train a classifier on an imbalanced dataset — 98% negative, 2% positive. The model learns to predict “negative” every time. Accuracy: 98%. Specificity: perfect. Recall on the class that matters: zero.
You didn’t skip Model Evaluation. You just used the wrong metric without the matrix that would have exposed the gap. That’s a specification failure, not a modeling failure.
Step 1: Map the Four Components
Your confusion matrix pipeline has four parts. Each one is a separate concern, and your AI tool will make assumptions about all four if you don’t specify them independently.
Your evaluation stack has these parts:
- Prediction generation — getting
y_trueandy_predinto the same format, same label encoding, same sample alignment - Matrix computation — choosing the library, normalization strategy, and label ordering
- Visualization — rendering the matrix as a heatmap with readable annotations
- Experiment logging — storing the matrix where you can compare it against previous runs
The Architect’s Rule: If you collapse these four concerns into a single “evaluate my model” prompt, the AI will pick defaults for each one. Those defaults may not match your dataset, your class distribution, or your team’s tracking setup.
Step 2: Lock Down the Matrix Specification
This is where most confusion matrix code goes sideways. The API surface looks simple — pass in true labels and predicted labels, get a matrix back. But the choices buried inside that call determine whether the matrix tells the truth or tells a comfortable story.
Context checklist:
- Normalization —
Nonegives raw counts.'true'normalizes by actual class, showing recall per class.'pred'normalizes by predicted class, showing precision per class.'all'normalizes over all samples. For imbalanced datasets,'true'normalization is almost always what you need. - Label ordering — specify your class labels explicitly. If you don’t, both scikit-learn and TorchMetrics will sort them alphabetically or numerically. That’s fine until “benign” comes before “malignant” and your matrix reads backwards from how your domain expert reads it.
- Threshold — for binary classification tasks, TorchMetrics defaults to 0.5 (TorchMetrics Docs). If your use case has asymmetric costs — missing a fraud matters more than a false alarm — your threshold should reflect that asymmetry.
- Library match — scikit-learn 1.8 if your workflow is NumPy-native. TorchMetrics 1.9 if you’re inside a PyTorch Lightning training loop. Don’t force a library swap just for the matrix.
The Spec Test: If your specification doesn’t mention normalization, the AI will use
None. On a dataset with 10,000 negatives and 200 positives, the raw-count matrix will look overwhelmingly blue in one quadrant — visually useless for catching the failure that actually matters.
Step 3: Connect Visualization to Tracking
A confusion matrix on your screen is useful once. A confusion matrix logged to your experiment tracker is useful every time you retrain. Here’s how each library handles the handoff.
scikit-learn path: ConfusionMatrixDisplay.from_predictions() replaced the deprecated plot_confusion_matrix() function, which was removed in version 1.2 (scikit-learn Docs). Call from_predictions(y_true, y_pred, display_labels=your_labels, normalize='true') and then .plot() to get a Matplotlib figure. That figure object is what you hand to your tracker.
TorchMetrics path: MulticlassConfusionMatrix(num_classes=n) requires the num_classes parameter — skip it and you get a runtime error, not a wrong answer. Call .compute() for the raw tensor, or .plot() for a Matplotlib figure (TorchMetrics Docs). BinaryConfusionMatrix and MultilabelConfusionMatrix follow the same pattern but don’t need num_classes.
W&B logging: Two entry points. wandb.sklearn.plot_confusion_matrix(y_true, y_pred, labels) auto-renders an interactive matrix in your W&B dashboard (W&B Docs). For non-sklearn workflows, wandb.plot.confusion_matrix(y_true=labels, preds=predictions, class_names=names) works with any framework. Either way, the matrix becomes a versioned artifact you can overlay with previous runs.
W&B’s free tier includes unlimited tracking hours and 100 GB of cloud storage (W&B Pricing). The Teams tier starts at $50/user/month, though this figure was sourced from rendered search results — verify it on the current pricing page before committing to a plan.
Build order:
- Matrix computation first — the output format (NumPy array vs. PyTorch tensor) determines which visualization and logging calls work
- Visualization second — you need to see a correct matrix before you automate the tracking
- Experiment logging last — it wraps the visualization output, not the raw matrix
Step 4: Prove the Matrix Is Honest
A confusion matrix can mislead you just as easily as a single accuracy number — if the specification underneath is wrong.
Validation checklist:
- Row-column orientation — rows must be actual classes, columns predicted classes. If they’re transposed, every downstream metric inverts. Failure looks like: precision and recall values are swapped compared to your classification report.
- Label alignment — the labels in
y_trueandy_predmust use the same encoding. Failure looks like: a matrix with unexpected nonzero values in positions that should be empty, or a matrix that’s larger than your number of classes. - Normalization sanity — if you chose
'true'normalization, every row should sum to 1.0. If a row sums to something else, sample weights or filtering introduced a bug. - Cross-run comparison — log two matrices from different training runs to W&B and overlay them. If the visual diff shows no change when you know the model changed, your logging pipeline is caching a stale result.
Security & compatibility notes:
- W&B Server Unauthorized Artifact Access: Versions 0.78.0 and 0.78.1 allow unauthorized artifact access. Fix: upgrade to v0.78.2+ (released March 10, 2026).
- W&B Server EOL: Versions 0.65 and below reached end-of-life on January 30, 2026. Upgrade to a supported release.
Common Pitfalls
| What You Did | Why It Broke | The Fix |
|---|---|---|
| Passed raw probabilities instead of class labels | Matrix dimensions exploded or threw a shape error | Threshold probabilities into class predictions before passing them to the matrix function |
| Let the library sort labels automatically | “Benign” came before “Malignant” — matrix read backwards from clinical expectation | Pass labels= or display_labels= explicitly in your specification |
Used normalize=None on imbalanced data | Matrix was visually dominated by the majority class | Switch to normalize='true' for a per-class recall view |
| Logged the Matplotlib figure, not the W&B call | Lost interactive features — no hover, no run comparison | Use wandb.sklearn.plot_confusion_matrix() or wandb.plot.confusion_matrix() directly |
Pro Tip
Every confusion matrix specification you write encodes a decision about what “wrong” means. A false positive and a false negative occupy the same visual weight in a raw-count matrix — but in your domain, one of them costs money, reputation, or safety. Specify the cost asymmetry before you specify the matrix layout. The matrix doesn’t judge. You do.
Frequently Asked Questions
Q: How to create and plot a confusion matrix in Python with scikit-learn 2026?
A: Use ConfusionMatrixDisplay.from_predictions(y_true, y_pred) and call .plot() — this is the current API in scikit-learn 1.8.0. The older plot_confusion_matrix() function was removed in version 1.2. One detail the guide doesn’t cover: pass colorbar=False when embedding matrices in a multi-plot grid, because overlapping colorbars make the combined figure unreadable.
Q: How to use a confusion matrix to debug and improve a classification model?
A: Read the matrix by rows, not by cells. Each row is one actual class — the off-diagonal entries show where that class gets misclassified and into which wrong class. If two classes frequently confuse each other, the problem is usually feature overlap, not model capacity. Try adding a distinguishing feature or merging the classes before adding more layers.
Q: How to log and compare confusion matrices across experiments in Weights and Biases?
A: Call wandb.sklearn.plot_confusion_matrix() inside your evaluation block. Each run logs its own matrix to the W&B dashboard. To compare, select multiple runs and view the confusion matrix panel side-by-side. Worth knowing:
Benchmark Contamination can make cross-run comparisons misleading if your test set leaked into training data between experiments.
Your Spec Artifact
By the end of this guide, you should have:
- Evaluation pipeline map — four components (prediction, matrix, visualization, logging) with clear boundaries between each
- Matrix parameter checklist — normalization mode, label ordering, threshold, and library selection locked to your dataset and workflow
- Validation criteria — row-column orientation, label alignment, normalization sanity, and cross-run comparison checks
Your Implementation Prompt
Paste this into your AI coding tool after filling in the bracketed values. It mirrors the decomposition from Steps 1 through 4 and produces a working evaluation script.
Build a confusion matrix evaluation pipeline for a [binary/multiclass] classification task with [number] classes.

Requirements:
1. Prediction generation: Load predictions from [source — CSV, model inference, saved tensor]. Load ground-truth labels from [source]. Ensure both use [label encoding — integer indices, string labels, or one-hot]. Align samples by [index column or position].

2. Matrix computation: Use [scikit-learn 1.8 / TorchMetrics 1.9]. Normalize using ['true' / 'pred' / 'all' / None]. Pass labels explicitly in this order: [class_0, class_1, ...]. For binary classification, set threshold to [0.5 or your custom value].

3. Visualization: Render using [ConfusionMatrixDisplay.from_predictions() / MulticlassConfusionMatrix.plot()]. Display labels as [readable_label_0, readable_label_1, ...]. Save figure as [PNG / SVG] to [output path].

4. Experiment logging: Log to [Weights & Biases / MLflow / local directory]. Use [wandb.sklearn.plot_confusion_matrix() / wandb.plot.confusion_matrix()]. Tag the run with [experiment name], [model version], and [dataset version].

5. Validation assertions:
   - Rows represent actual classes, columns represent predicted classes
   - If normalize='true', assert each row sums to 1.0
   - Matrix shape equals [number of classes] x [number of classes]
   - No label values outside the specified class list appear in output
Ship It
You now have a four-layer decomposition for confusion matrix evaluation — prediction, computation, visualization, logging — with the parameter decisions locked down before your AI tool writes a single line. The next time accuracy looks too good, you have the spec to expose what it hid.
AI-assisted content, human-reviewed. Images AI-generated. Editorial Standards · Our Editors