How to Build an LLM Logging Pipeline with Langfuse, MLflow, and OpenTelemetry in 2026
TL;DR
- Specify your schema before you instrument — OpenTelemetry gen_ai.* attributes define what every span must capture, and that decision belongs in the spec, not the implementation
- Langfuse v3 and MLflow 3.14 both speak OTel natively; wire them from one schema and both observability layers benefit from the same signal
- Cost attribution and GDPR compliance are architectural decisions — build them into the logging contract before any feature ships, not after the first invoice arrives
You shipped the feature. The model is responding. Then the monthly invoice lands and nobody can trace which product feature consumed the largest share of tokens. Nobody knows whether any response contained personal data that shouldn’t have left your infrastructure. The logs exist — but they’re unstructured, unattributed, and useless for anything beyond debugging the most obvious crash.
That’s the logging gap. Not missing data. Missing design.
Before You Start
You’ll need:
- An AI coding tool: Claude Code, Cursor, or Codex
- Familiarity with LLM Observability concepts and basic OpenTelemetry spans
- A clear picture of which teams, features, or customers your LLM pipeline serves
This guide teaches you: how to decompose a LLM Logging And Auditing pipeline into three distinct layers, write a schema contract before touching any SDK, and wire Langfuse, MLflow, and OpenTelemetry into a specification your AI coding tool can build from a clear blueprint.
The Silent Invoice: What Happens When You Skip the Logging Spec
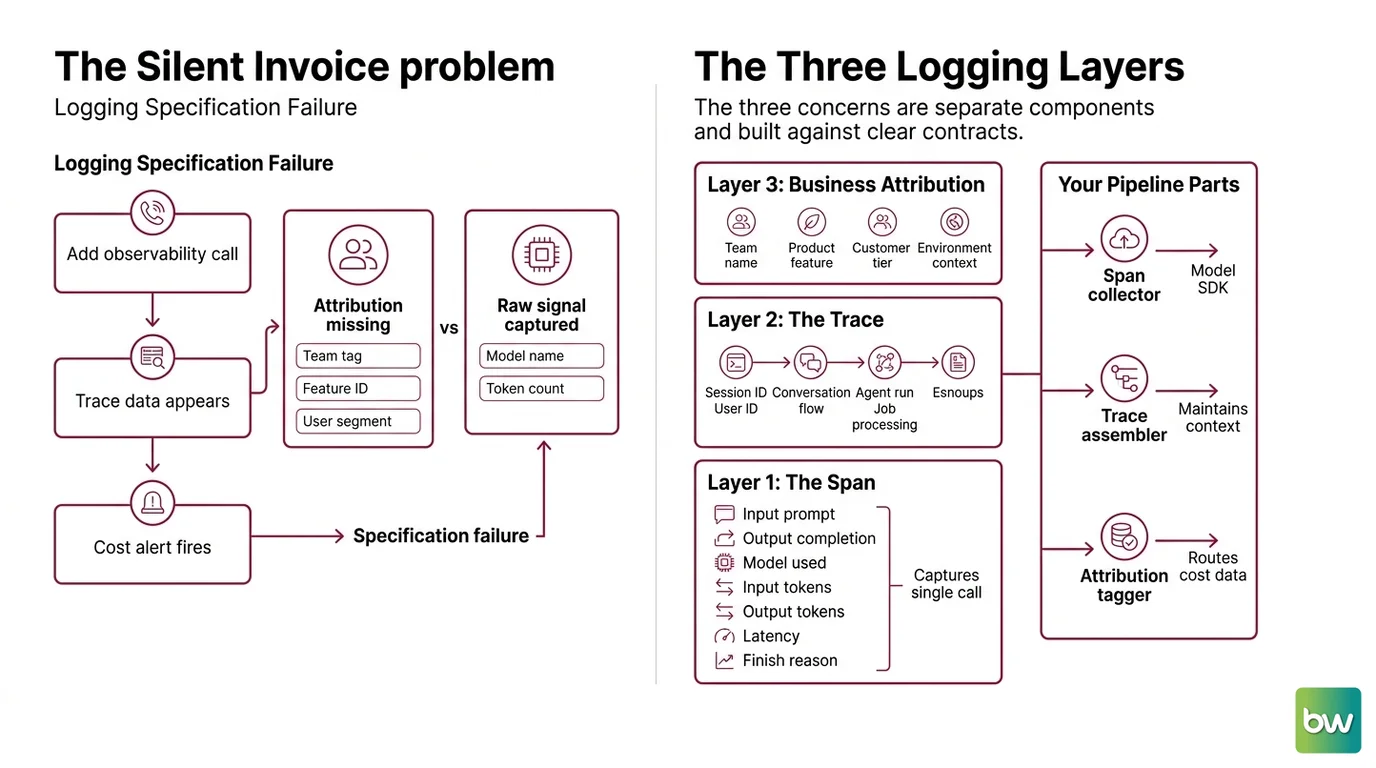
You add an observability call to the LLM on Tuesday. By Friday, you have trace data in the dashboard. By end of month, the cost alert fires and you have no idea which feature triggered it — because the trace has model name and token count but no team tag, no feature ID, no user segment.
The logging is there. The attribution is missing. And attribution is the part you needed for the invoice, the audit, and the A/B test rollback.
It worked on staging. In production, the prompt template changed, the model tier switched, and three teams are now sharing a single API key with no per-request tagging. That’s not a monitoring failure. That’s a specification failure.
Step 1: Map the Three Logging Layers
Every LLM logging pipeline has three distinct concerns. Treat them as separate components. Build each against a clear contract.
Layer 1 — The Span captures a single LLM call: input prompt, output completion, model used, input tokens, output tokens, latency, and finish reason. This is the raw signal. Every other layer derives from it.
Layer 2 — The Trace groups spans into meaningful units: a conversation, a multi-step agent run, a document processing job. A trace has a session ID, a user ID, and a parent-child relationship between spans. Without this layer, you can analyze individual calls but not user journeys or agent chains.
Layer 3 — Business Attribution stamps each trace with context your organization actually uses: team name, product feature, customer tier, environment. This is the layer that turns LLM Cost Management from a monthly surprise into a per-feature budget line.
Your pipeline has these three parts:
- Span collector — captures LLM call data; interfaces with your model provider’s SDK
- Trace assembler — groups spans; maintains session and user context across calls
- Attribution tagger — adds business metadata; routes cost data to the correct team or feature
The Architect’s Rule: If you can’t name who owns the cost of each trace, the AI coding tool building your pipeline can’t enforce that constraint either. Attribution belongs in the spec before the first line of instrumentation.
Step 2: Specify the Schema Before You Touch Any SDK
The
OpenTelemetry GenAI semantic conventions define a standard attribute set for LLM spans. As of mid-2026, these attributes live in a dedicated semantic-conventions-genai repository and are explicitly experimental — attribute names may change before the spec stabilizes (OTel Blog). Build against them, but name the risk in your context file.
Core attributes your schema must include:
gen_ai.system— the model provider (openai, anthropic, google)gen_ai.request.model— the specific model namegen_ai.usage.input_tokens— token count for the promptgen_ai.usage.output_tokens— token count for the completion
Custom attributes for business attribution (your additions):
custom.team_id— the team that owns this callcustom.feature_id— the product feature triggering the callcustom.environment— production, staging, or canarycustom.pii_risk_level— low, medium, or high, based on the input domain
Context checklist:
- OTel gen_ai.* attributes listed explicitly, with an inline comment noting the experimental status and the
semantic-conventions-genaischema URL - Custom business attribution attributes defined and typed
- PII classification strategy documented — which fields may contain personal data, and at which point masking fires
- Retention policy specified per tier: debug logs vs. compliance logs vs. audit-grade logs have different lifespans
- Data region requirement captured — EU, US, or HIPAA storage zone
The Spec Test: If your context file doesn’t specify whether inputs containing personal data should be masked before leaving the client or after ingestion, the AI coding tool will pick one approach. Usually the one that ships a customer’s name to a US data center when your GDPR contract requires EU storage.
Step 3: Wire Langfuse, MLflow, and Cost Attribution
Three tools, three jobs. Don’t conflate them.
Langfuse v3 is your primary observability hub. Since v3 rebuilt on OTel natively, it receives any OTel-compliant span without adapter code (Langfuse Docs). The Hobby plan is free — 50,000 units per month, 30-day retention, two users. The Core plan at $29/month extends that to 100,000 units and 90-day retention with unlimited users. For teams with compliance requirements, the Pro plan at $199/month adds SOC2 Type II, ISO27001, and HIPAA certification with three-year log retention (Langfuse’s pricing page).
One thing the pricing page doesn’t surface immediately: a “unit” in Langfuse is one observation — a trace, a span, a score, or a generation event. A multi-step agent run generates several units per user request, not one. High-volume systems should model their expected unit volume before committing to a tier; overage runs $8 per 100,000 additional units (Langfuse’s pricing page).
MLflow 3.14.0 (released June 17, 2026) handles the MLOps side — experiment tracking, the
Model Registry, and evaluation runs. Its LLM tracing is OTel-compatible and captures inputs, outputs, latency, and cost signals from OpenAI, LangChain, LlamaIndex, DSPy, and Pydantic AI with minimal configuration (MLflow Docs). Onboarding takes one command: mlflow agent setup. The result is a local or remote MLflow server receiving the same OTel signal your Langfuse instance already consumes (MLflow Docs).
Cost attribution is where the 2026 tool picture gets complicated. Helicone and Portkey were the leading LLM proxy cost-attribution layers until Q1–Q2 2026. Both have since changed ownership.
Compatibility notes:
- Helicone: Acquired by Mintlify (March 2026); entered maintenance mode — bug fixes only, no new feature development (DEV Community). Current plans remain active, but the product roadmap is frozen. Avoid creating a hard dependency on Helicone-specific features for new builds.
- Portkey: Acquired by Palo Alto Networks (April 30, 2026); the managed cloud roadmap is uncertain post-acquisition (TrueFoundry Blog). The Apache 2.0 gateway is open-sourced and self-hostable — the self-hosted path remains viable when you control the infrastructure. It routes to 1,600+ LLMs and includes 50+ built-in guardrails (Portkey GitHub).
For cost attribution on new builds: Portkey’s self-hosted Apache 2.0 gateway gives you virtual keys with per-team budgets and metadata tags that route each request’s cost to the correct feature ID in your reporting layer, without depending on a managed cloud service. That’s the option with the clearest ownership picture right now.
If your team already runs self-hosted Langfuse, its built-in token cost tracking handles attribution at the token level directly — no proxy layer required for basic cost breakdown.
For GDPR compliance, Langfuse provides a DPA on all tiers, including the free Hobby plan, with EU, US, and HIPAA data regions available on paid plans (Langfuse Docs). PII Redaction happens at two points: client-side SDK masking before data leaves your application, and server-side ingestion masking on self-hosted deployments. The Audit Trail with full log access is an Enterprise-tier feature ($2,499/month), but three-year log retention on the Pro plan covers most standard compliance contracts.
Specify your data flow decisions in the context file:
- Where PII masking fires — client SDK before serialization, or server ingestion after transport
- Which data region receives which trace type — EU vs. US endpoint routing
- Which retention tier satisfies your compliance contract — 30-day, 90-day, or 3-year
- Whether cost attribution runs through a proxy (Portkey self-hosted) or native Langfuse token tracking
These are not implementation details. They are constraints. Document them in the spec before your AI coding tool writes a single line of instrumentation.
Step 4: Validate the Pipeline Before Any Feature Ships
Validation checklist:
- Spans appear in the Langfuse dashboard within 5 seconds of a test call — failure looks like: no spans; the OTel exporter endpoint or API key is misconfigured
- Token counts in Langfuse match the provider’s usage dashboard — failure looks like: consistent divergence between the two; you are capturing estimated token counts rather than the provider’s reported count
- A test prompt containing a known synthetic PII pattern (a fake name, a fake email address) does not appear unmasked in the span attributes — failure looks like: raw text visible in the trace; client-side masking fired after serialization
- A trace tagged with
custom.team_id: "platform"appears correctly bucketed in your cost attribution view — failure looks like: the tag is present on the span but absent from the cost report; the attribution query is not reading custom attributes - A test run through MLflow’s tracing interface captures the same input/output pair as Langfuse — failure looks like: MLflow showing empty spans; the OTel signal is not reaching the MLflow collector endpoint
The Structured Logging spec is working when every check passes on a deliberate test call, not just when the dashboard looks busy.
Common Pitfalls
| What You Did | Why the Pipeline Failed | The Fix |
|---|---|---|
| Added logging after the feature shipped | No schema existed; attribution was retrofitted per-call, inconsistently | Write the schema contract in Step 2 before any instrumentation starts |
| Used one shared API key for all teams | No per-request metadata; cost aggregation by team is impossible | Switch to Portkey virtual keys or Langfuse organization tags before multi-team launch |
| Logged full prompts without a PII review | Customer data visible in the observability dashboard; GDPR exposure | Add custom.pii_risk_level to the schema and configure client-side masking for high-risk inputs |
| Treated gen_ai.* attributes as stable API | An attribute rename in the genai semconv repo broke the exporter silently | Pin to a specific schema URL in your OTel config; test on every dependency update |
| Sent all traces to a US Langfuse data region | EU customer data crossed a regional boundary without a legal basis | Specify the data region in the spec before deployment; region migration after ingestion is manual work |
Pro Tip
The same attribution schema that feeds your logging pipeline also feeds your
A/B Testing for LLMs analysis. If custom.feature_id and custom.team_id are in every span, your experiment results group themselves automatically — no post-processing join required. The logging spec and the experiment tracking spec are the same document. Write one contract. Both systems benefit.
Frequently Asked Questions
Q: How to set up LLM logging with Langfuse and OpenTelemetry step by step in 2026?
A: Write your schema contract first — gen_ai.* attributes plus your custom business tags. Configure an OTel exporter pointing at your Langfuse v3 endpoint with your API key. Run mlflow agent setup in parallel if you also need the MLOps layer. The wiring follows directly from the schema. Watch out: Langfuse’s free tier caps at 50,000 units per month — in a multi-step pipeline, one user request can consume several units.
Q: How to use LLM audit trails for GDPR-compliant data handling in 2026? A: Langfuse provides a DPA on every tier including free, with EU, US, and HIPAA data regions available (Langfuse Docs). The Pro plan (3-year retention) covers most compliance contracts; Enterprise adds formal audit log access. The critical decision comes before deployment: specify your data region and PII masking strategy in the logging contract. Fixing region assignment after data has been ingested requires a manual migration with no automated tooling.
Q: How to attribute LLM API costs to teams or product features using Helicone or Portkey? A: Both tools changed ownership in early 2026. Portkey’s Apache 2.0 self-hosted gateway is the cleaner option — virtual keys assign per-team budgets, and metadata tags route each request’s cost to the correct feature ID in your reporting layer. For teams already running self-hosted Langfuse, the built-in token tracking handles basic attribution without adding a proxy. Helicone is in maintenance mode post-Mintlify acquisition — functional for existing setups, not recommended for greenfield builds.
Q: How to use structured log schemas for downstream analysis in LLM pipelines? A: Define attribute names and types in the spec — not inside the instrumentation code. Downstream analysis (cost rollups by team, latency percentiles by feature, error rates by model) works only when every span uses consistent attribute keys. Use OTel gen_ai.* as the base, add your custom attribution attributes, and enforce the schema at the exporter configuration level. When the schema is consistent, the analysis queries are trivial to write; when it isn’t, no dashboard fixes the gap.
Your Spec Artifact
By the end of this guide, you should have:
- A three-layer logging schema: span attributes (OTel gen_ai.* plus custom attribution tags), trace context (session and user IDs), and business attribution (team, feature, environment)
- A compliance decision record: PII masking strategy, data region assignment, and which retention tier covers your compliance contract
- A validation checklist: five tests that confirm the pipeline is working correctly before any production traffic routes to it
Your Implementation Prompt
Use this prompt in Claude Code, Cursor, or Codex when you’re ready to generate the instrumentation layer. Every bracket maps to a specific decision from Steps 1–4 in this guide.
You are building the LLM logging instrumentation layer for a production application.

Architecture requirements:
- Layer 1 (Spans): Capture gen_ai.system, gen_ai.request.model,
  gen_ai.usage.input_tokens, gen_ai.usage.output_tokens, and latency per LLM call.
  Add an inline comment noting that gen_ai.* attributes are experimental
  (semantic-conventions-genai repo) and the schema URL may change.
- Layer 2 (Traces): Group spans under session IDs and user IDs using OTel trace context.
- Layer 3 (Attribution): Tag every trace with:
  custom.team_id=[your team name]
  custom.feature_id=[your feature name]
  custom.environment=[prod|staging|canary]
  custom.pii_risk_level=[low|medium|high]

Tooling:
- Observability backend: [Langfuse v3 | self-hosted Langfuse] at [your endpoint URL]
- OTel exporter: OTLP HTTP to Langfuse endpoint, authenticated with [your API key]
- MLflow: [yes | no] — if yes, run mlflow agent setup and route the same OTel signal
  to [your MLflow tracking URI]
- Cost attribution: [Portkey self-hosted gateway with virtual keys | Langfuse native
  token tracking]

PII handling:
- Client-side masking: [yes | no] — if yes, mask [list your PII field names] before
  serializing to OTel. Replace with a hashed placeholder; do not truncate.
- Server-side masking: [yes | no — only for self-hosted Langfuse deployments]
- Set custom.pii_risk_level="high" for any trace where the input domain is
  [your high-risk domain description]. Do not log raw prompt content on high-risk traces.

Data region:
- Langfuse endpoint must be the [EU | US | HIPAA] region endpoint.
- Reject any trace configuration that would route to a different region.

Constraints:
- Every span must include all three attribution tags (custom.team_id, custom.feature_id,
  custom.environment). If any tag is missing, log an error and abort the LLM call.
- Do not suppress OTel export errors silently — surface them as warnings in the
  application log.

Validation: After generating the instrumentation, produce a test script that:
1. Sends one test call and confirms a span appears in Langfuse within 5 seconds
2. Compares token counts in the span against the provider API response — flag if they differ
3. Sends a prompt containing [your synthetic PII test string] and confirms it does not
   appear unmasked in the span attributes
4. Verifies all three attribution tags are present on the test trace
5. Confirms the MLflow collector shows the same input/output as Langfuse (if MLflow is enabled)
Ship It
You now have three things most teams skip: schema that defines what gets logged, an attribution contract that ties costs to features and teams, and a validation step that confirms the pipeline is working before any production traffic hits it. The spec is the spec. The AI coding tool builds from it. The invoice becomes readable — and the audit has evidence.
AI-assisted content, human-reviewed. Images AI-generated. Editorial Standards · Our Editors