False Positives, Delayed Labels, and the Technical Limits of Data Drift Detection
ELI5
Data drift detection watches whether incoming data still resembles your training data. The catch: it raises alarms for harmless shifts, stays silent on some damaging ones, and never tells you directly whether accuracy actually dropped.
Picture a monitoring dashboard glowing red. Seventeen features have drifted, the alerts insist, and someone gets paged before sunrise. The model’s accuracy that morning is unchanged. This is the recurring paradox of Data Drift detection: it often fires loudest when nothing is wrong, then falls silent at the exact moment something quietly breaks.
The instinct is to treat every red alert as a defect to chase. The instinct is wrong. Most of those alarms are not telling you the model degraded — they are telling you that the math underneath the detector is doing precisely what it was built to do.
The Vanishing P-Value
Most drift detectors start their life as a hypothesis test. They take a reference window of training data, take a fresh window of production data, and ask a statistical question: are these two samples drawn from the same distribution? The trouble begins the moment that question meets a large dataset, because the test was never designed to answer “did anything practically meaningful change?” It answers a narrower question, and answers it far too eagerly.
Why does data drift detection produce false alarms?
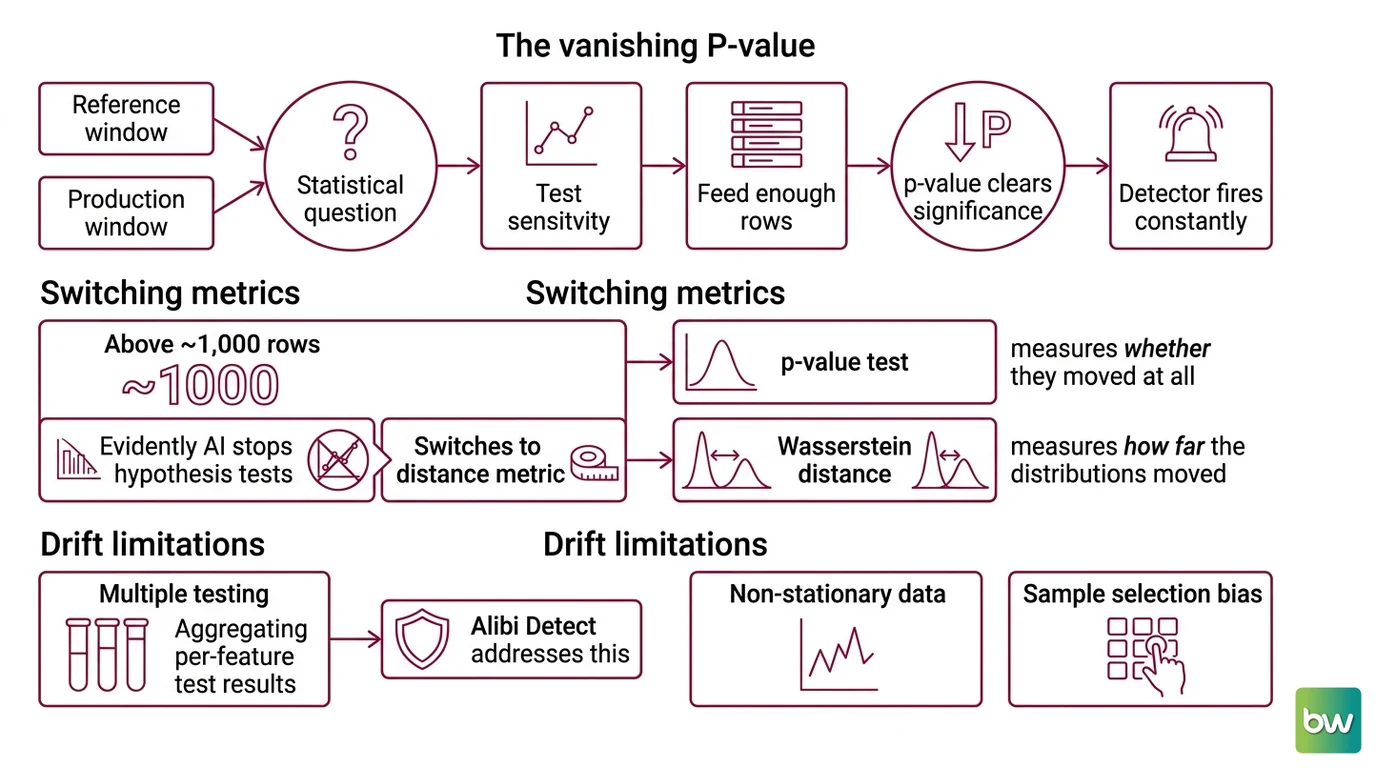
The mechanism is statistical power. A two-sample test like the Kolmogorov-Smirnov Test compares two distributions and returns a p-value — the probability that you would see a difference this large if the two samples really came from the same source. As your sample grows, the test’s sensitivity grows with it. Feed it enough rows and a difference of no practical consequence still clears the significance line.
Evidently AI calls this the vanishing p-value problem: statistical power scales with sample size, so trivial, practically irrelevant differences become statistically significant, and the detector fires constantly (Evidently Blog). The fix is not a better p-value. Above roughly a thousand rows, Evidently stops using hypothesis tests for numerical features and switches to a distance metric, the Wasserstein Distance, which measures how far the distributions moved rather than whether they moved at all.
Not a model failure. A property of the test itself.
What are the limitations of data drift detection methods?
The false-alarm storm has three structural sources, and none of them are bugs.
The first is multiple testing. A real feature table has dozens of columns, and most detectors test each one independently. Run enough independent tests at a fixed significance level and false positives accumulate by arithmetic alone. Alibi Detect addresses this by aggregating per-feature KS p-values with a Bonferroni or False Discovery Rate correction, deliberately raising the bar before it calls the dataset drifted (Alibi Detect Docs).
The second is threshold arbitrariness. The Population Stability Index is read against a familiar convention — below 0.1 means no significant shift, 0.1 to 0.2 moderate, above 0.2 significant — but that scale is a rule of thumb inherited from credit scoring, not a derived statistical boundary (Evidently Docs). It works until your problem looks nothing like a credit portfolio.
The third sits underneath the other two: the default test depends on your data, not your model. Evidently’s default behavior selects the method by column type and sample size:
| Data type | ≤ 1,000 observations | > 1,000 observations |
|---|---|---|
| Numerical | Kolmogorov-Smirnov test (p < 0.05) | Wasserstein distance (~0.1) |
| Categorical | Chi-square test | Jensen-Shannon distance |
A dataset is then flagged as drifted when at least half its columns drift, a threshold that is itself adjustable (Evidently Docs). Every one of these choices is reasonable. None of them knows anything about whether the shift it detected actually crosses your model’s decision boundary. Distance in input space is not the same as error in output space, and that gap is the real limit of every method on this list.
Drift Without Damage
Here the detective story turns. If drift detectors raise so many alarms that miss the target, the obvious question is whether you should ignore them entirely and watch the only number that pays the bills: the model’s accuracy.
Is monitoring data drift necessary if you can measure model performance directly?
When fresh, trustworthy labels arrive quickly, the honest answer is that performance measurement wins. Drift is a proxy for the thing you actually care about, and a measured accuracy drop beats an inferred one every time. NannyML makes this case directly: not all data drift affects performance, drift monitoring tends to overwhelm teams with false alarms, and drift in low-importance features routinely has no performance impact at all (NannyML Blog).
This follows from how models weight their inputs. A pronounced Covariate Shift in a feature the model barely relies on moves the input distribution without moving a single prediction. The detector sees a large distance; the decision boundary never notices. Drift is a signal about your data, not a measurement of your model — and when you can measure the model directly, you should.
So if performance metrics are strictly better when available, why does drift detection survive as a discipline at all? Because “when available” is doing enormous work in that sentence.
The Blind Window
The reason Model Monitoring cannot simply abandon drift detection is that, for a large class of production systems, the ground truth you would need to compute accuracy does not exist yet — and will not for a long time.
Why is drift detection essential when ground-truth labels are delayed?
Consider a loan default model. The label — did this borrower default? — may not resolve for months. Churn, fraud confirmation, long-cycle medical outcomes, insurance claims: each shares the same shape. The prediction is made today; the truth that scores it arrives weeks or quarters later. During that interval you are operating blind. You cannot compute accuracy, you cannot observe Label Drift, and a real degradation can run unchecked the entire time the labels are in transit.
Drift detection is what fills that blind window. Input data arrives in real time even when labels do not, so a covariate shift on a high-importance feature is often the only early evidence that the world has moved out from under the model. It is a leading indicator standing in for a lagging one.
A middle path has emerged for exactly this gap. NannyML estimates model performance without labels through Confidence-Based Performance Estimation for classification and Direct Loss Estimation for regression, and positions itself as the only open-source library capable of fully capturing the impact of data drift on performance — a vendor claim worth weighing as that (NannyML Docs). The approach reframes the problem: instead of asking “did the data move?”, it asks “given how the data moved, what is the model’s accuracy likely doing right now?”
What the Statistics Predict
The mechanism makes the failure modes predictable. Treat these as if/then expectations rather than surprises:
- If your alarm rate spikes after a traffic surge but accuracy holds, suspect the growing sample size inflating statistical power, not the model.
- If drift fires on a feature the model weights lightly, expect no performance change — the boundary did not move even though the distribution did.
- If labels are weeks out and drift climbs on a high-importance feature, treat it as a genuine early warning and investigate before the labels arrive to confirm it.
- If single feature shifts only slightly yet many predictions flip, no distribution test will catch it, because the shift is small in input space and large in output space.
The practical consequence is a discipline about what an alarm is allowed to mean. A drift signal that climbs while estimated performance holds is a candidate for Model Retraining, not a trigger for it; the retraining decision belongs to a performance hypothesis, not a p-value crossing a line.
Rule of thumb: Tie every drift alarm to a performance hypothesis. If you cannot name the metric a given drift would damage, you do not have an alert — you have a notification.
When it breaks: Drift detection is blind to the model’s decision boundary. A shift can move every input feature and never cross the boundary that matters, or move one feature slightly and flip thousands of predictions. Distance between input distributions is not the same as error in the output, and no statistical test closes that gap on its own.
Where the Tools Stand
The open-source options divide cleanly by what they actually measure, which matters more than their version numbers. As of mid-2026:
- Evidently (0.7.21) — the most active option; 20-plus statistical tests and distance metrics for input-distribution drift, with the sample-size-aware method switching described above.
- NannyML (0.13.1) — the differentiator is performance estimation under delayed or absent labels, the direct counter to drift false positives.
- Alibi Detect (0.13.0) — the broadest detector menu, online and offline, with multivariate corrections built in for the multiple-testing problem.
- whylogs (1.6.4, December 2024) — a profiling and logging foundation that produces drift reports from statistical profiles, but the open-source core is now inactive and WhyLabs is winding down operations. Treat Whylogs as legacy rather than a leading active choice.
The Data Says
Drift detection measures the distance between two distributions, not the damage to a model. On large datasets that distance almost always tests as significant, which is why hypothesis-test alarms read as constant noise. Use drift as an early-warning sensor for the blind window when ground-truth labels are late, and let estimated or measured performance — not p-values — decide when to retrain.
AI-assisted content, human-reviewed. Images AI-generated. Editorial Standards · Our Editors