Demographic Parity vs. Equalized Odds vs. Calibration: Core Fairness Metrics Compared
Table of Contents
ELI5
Fairness metrics measure whether an AI system treats different groups equally — but “equally” has at least three mathematical definitions, and satisfying one can violate another.
A hiring algorithm rejects more candidates from one demographic group than another, and the team building it disagrees about whether the system is biased — not because anyone is lying, but because each person is measuring fairness with a different ruler. One checks whether acceptance rates match across groups; another checks whether the model’s errors are distributed equally; a third checks whether a risk score of 0.8 means the same thing regardless of who received it. All three analyses are mathematically valid. All three produce contradictory verdicts from identical data.
The Three Families That Refuse to Converge
Bias And Fairness Metrics did not emerge from a single coherent tradition. They were born in separate communities — anti-discrimination law, statistical decision theory, and probability calibration — each encoding a different intuition about what “fair” should mean. The result is three families of metrics that share a vocabulary but disagree on the math (Fairlearn Docs).
What are the main types of fairness metrics used in AI systems?
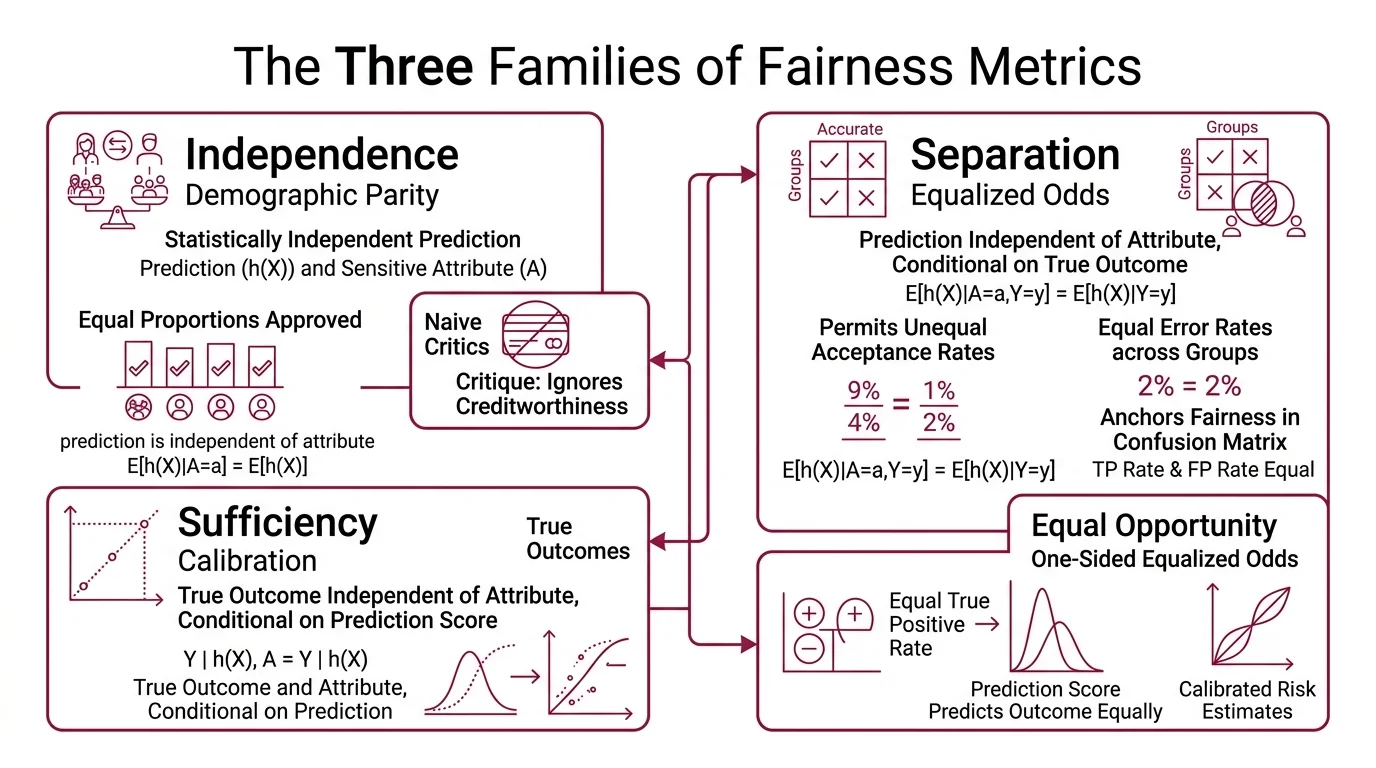
The three families are Independence, Separation, and Sufficiency. The fastest way to understand them is through what each one ignores.
Independence ( Demographic Parity): the prediction should be statistically independent of the sensitive attribute. Formally, E[h(X)|A=a] = E[h(X)] for all values of a. A loan approval system satisfies demographic parity if it approves the same proportion of applicants in every group — period. It does not ask whether those applicants are equally creditworthy. That is both its appeal and the reason critics call it naive.
Separation ( Equalized Odds): the prediction should be independent of the sensitive attribute conditional on the true outcome. Formally, E[h(X)|A=a,Y=y] = E[h(X)|Y=y] for all a and y (Hardt et al.). The model’s true positive rate and false positive rate must be equal across groups. Separation permits unequal acceptance rates — as long as the errors are distributed fairly. It anchors fairness in the Confusion Matrix, not the outcome distribution.
A relaxation called equal opportunity requires only that the true positive rate be equal across groups, dropping the constraint on false positives. When the ML fairness literature mentions “equality of opportunity,” this is usually what it means — a one-sided version of equalized odds.
Sufficiency (calibration): the true outcome should be independent of the sensitive attribute conditional on the prediction score. Formally, P[Y=1|S=s,A=a] = P[Y=1|S=s] for all s and a (Kleinberg et al.). A risk score of 0.7 should mean a 70% probability of the event, whether the individual belongs to group A or group B. Calibration does not care about acceptance rates or error rates. It cares about whether the score means what it claims to mean.
Three definitions. Three axioms. Each captures something real about fairness — and each is blind to what the others measure.
Inside the Arithmetic of Disagreement
The tension between these metrics is not philosophical. It is arithmetic — visible the moment you apply two definitions to the same classifier on the same data. The gap between them reduces to a single variable, and once you see it, the impossibility results that follow become almost obvious.
What is the difference between demographic parity and equalized odds?
Demographic parity asks: does the system produce the same positive rate across groups? Equalized odds asks: given what the right answer actually is, does the system make the same mistakes across groups?
The distinction collapses to a single conditioning variable: the true label Y.
Suppose group A has a 30% base rate for the positive outcome and group B has a 60% base rate. A perfectly accurate classifier — one that makes zero errors — will automatically violate demographic parity. It approves 30% of group A and 60% of group B. Unequal rates, but correctly reflecting the underlying populations.
Equalized odds is satisfied by this perfect classifier because both groups have identical TPR (100%) and identical FPR (0%). The errors are equal; they are both zero.
Demographic parity, forced to equalize the rates, would require the system to either approve more people from the low-base-rate group or reject more from the high-base-rate group. Both adjustments introduce errors that were not present before. The collision is not ideological — it is about base rates. When the underlying prevalence of the positive outcome differs between groups, equalizing outcomes and equalizing errors become mathematically incompatible goals.
Calibration adds a third axis of tension. A calibrated model assigns scores that reflect true probabilities — but if base rates differ, a calibrated model will necessarily produce different acceptance rates per group. Calibration and demographic parity pull in opposite directions whenever the population data is not identically distributed across groups.
What statistics and probability concepts do you need to understand bias and fairness metrics?
The math underneath fairness metrics is conditional probability — and the errors that matter live in the confusion matrix.
Four numbers define the confusion matrix for a binary classifier: true positives (TP), false positives (FP), true negatives (TN), and false negatives (FN). Every fairness metric is a constraint on ratios derived from these four counts, computed per group.
- True positive rate (TPR, recall): TP / (TP + FN) — of all actual positives, how many did the model catch?
- False positive rate (FPR): FP / (FP + TN) — of all actual negatives, how many did the model wrongly flag?
- Positive predictive value (PPV, precision): TP / (TP + FP) — of all predicted positives, how many were correct?
Equalized odds constrains TPR and FPR. Calibration constrains PPV (among other quantities). Demographic parity ignores all of these and looks only at the overall positive prediction rate.
The concept of base rate — the prevalence of the positive class in each group — is the variable that determines whether these constraints can coexist. When base rates are equal across groups, most fairness metrics can be satisfied simultaneously. When they differ, the Impossibility Theorem activates.
Bayes’ theorem connects these rates: the relationship between TPR, FPR, PPV, and base rate is not independent. Shift one constraint, and the others move. This is not a design flaw in the metrics. It is a consequence of probability itself.
The Theorem That Forbids Compromise
The impossibility results arrived in 2016 and 2017, from two independent directions, and they settled a question many practitioners had hoped to solve with better algorithms.
Kleinberg, Mullainathan, and Raghavan proved that calibration and certain balance conditions — which relate to equalized odds — cannot be simultaneously satisfied except in trivial cases where the classifier is either perfect or the base rates are identical across groups (Kleinberg et al.). Chouldechova proved a complementary result: when base rates differ, no classifier can simultaneously equalize FPR, FNR, and PPV (Chouldechova).
Not a limitation of current methods. A mathematical boundary.
The implication is uncomfortable but precise: choosing a fairness metric is a normative decision, not a technical one. The math tells you what each metric measures and what it ignores. It cannot tell you which trade-off is acceptable for your application.
In employment contexts, the Four Fifths Rule provides a regulatory anchor — the selection rate for any group must be at least 80% of the highest group’s rate (EEOC). This is a practical instantiation of the demographic parity family, codified in U.S. federal guidelines long before ML fairness became a research field.
The tooling has caught up to the theory.
Fairlearn (v0.13.0, as of October 2025) provides demographic_parity_difference(), equalized_odds_difference(), and their ratio variants — all scikit-learn compatible (Fairlearn Docs).
AI Fairness 360 offers 15 mitigation algorithms covering pre-processing, in-processing, and post-processing interventions; its sklearn-compatible API is the recommended path, though the last release (v0.6.1) dates to April 2024 — verify current development activity before adopting for new projects (AIF360 GitHub).
Neither toolkit resolves the impossibility theorems. They make it easier to measure and mitigate along whichever axis you choose — but the choice itself remains yours.
Rule of thumb: Pick the metric that aligns with the harm you most need to prevent. If wrongful rejection destroys a livelihood, equalize false negative rates. If wrongful acceptance creates risk, equalize false positive rates. If the score feeds directly into downstream decisions, calibrate.
When it breaks: When base rates differ substantially between groups — common in criminal justice, healthcare, and lending — optimizing one fairness metric actively degrades another. Teams that skip the normative conversation and default to whatever metric the library computes first end up encoding a value judgment they never explicitly made. The impossibility theorems guarantee that no algorithm resolves this on their behalf. Counterfactual Fairness offers an alternative framing — asking whether the prediction would change if the individual belonged to a different group — but it requires causal models that are rarely available in practice.
The Data Says
Fairness metrics are not competing answers to the same question. They are answers to three different questions — about outcomes, about errors, and about meaning — that happen to share a name. The impossibility theorems prove they cannot be unified when base rates diverge. Choosing among them is the first engineering decision in any fairness pipeline, and it is not a decision any algorithm can make. A model that produces a Hallucination about its own fairness — reporting one metric as if it settles the matter — is arguably more dangerous than a model with a known, documented bias.
AI-assisted content, human-reviewed. Images AI-generated. Editorial Standards · Our Editors