Covariate Shift, Concept Drift, and Label Drift: The Types of Data Drift and the Statistics to Detect Them
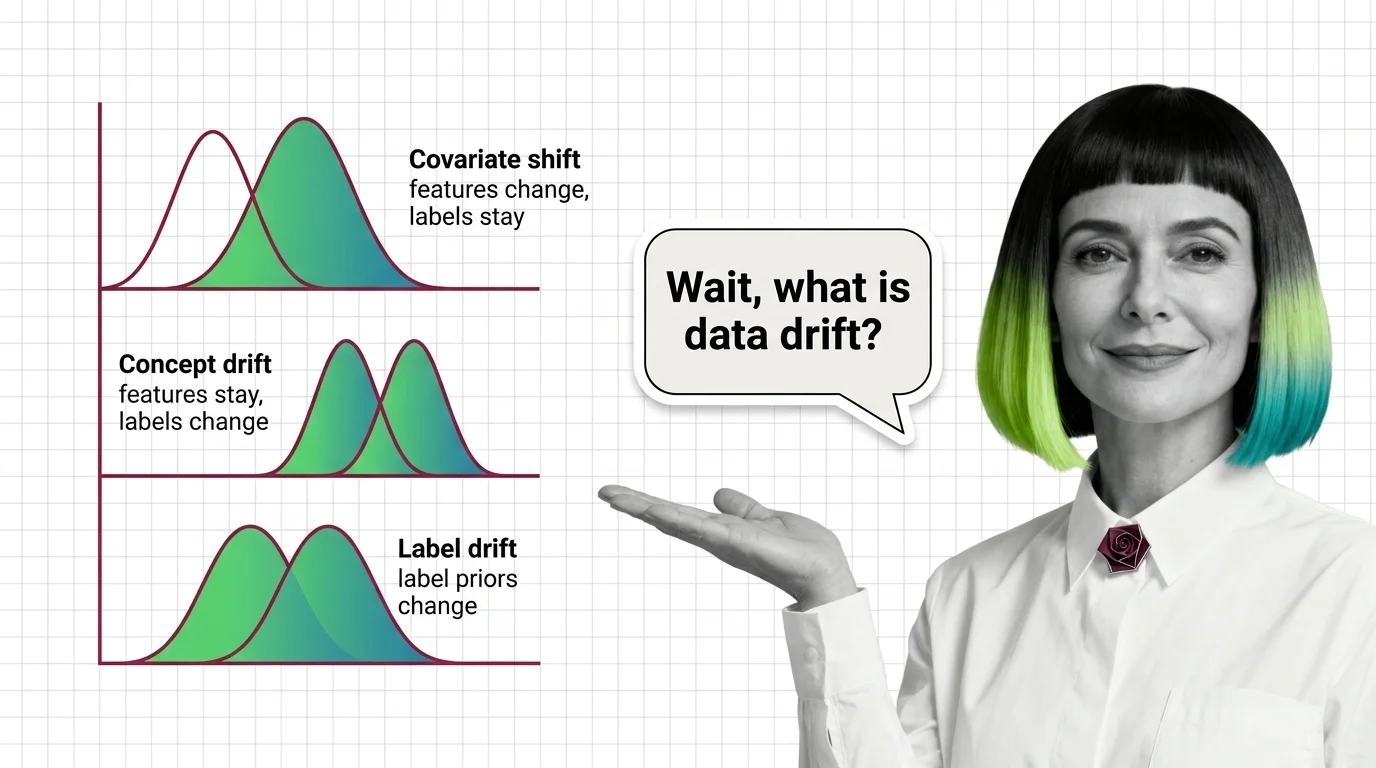
ELI5
Data drift is when live data stops matching a model’s training data. It arrives in three forms — the inputs shift, the input-to-output rule shifts, or the output mix shifts — and each one leaves a distinct statistical fingerprint.
A fraud model holds high precision for months. Then, over a few weeks, it quietly degrades — no exception thrown, no code changed, no alert fired. The training data never moved; the world did. That widening gap between the data a model learned and the data it now sees is Data Drift, and the sharper question is not whether something drifted but which part moved.
Most monitoring setups treat that gap as a single alarm: one drift score, one threshold, one notification. The math underneath says otherwise. There are three distinct distributions that can move, they move for different reasons, and no single statistic catches all three.
Three Distributions, Three Ways to Break
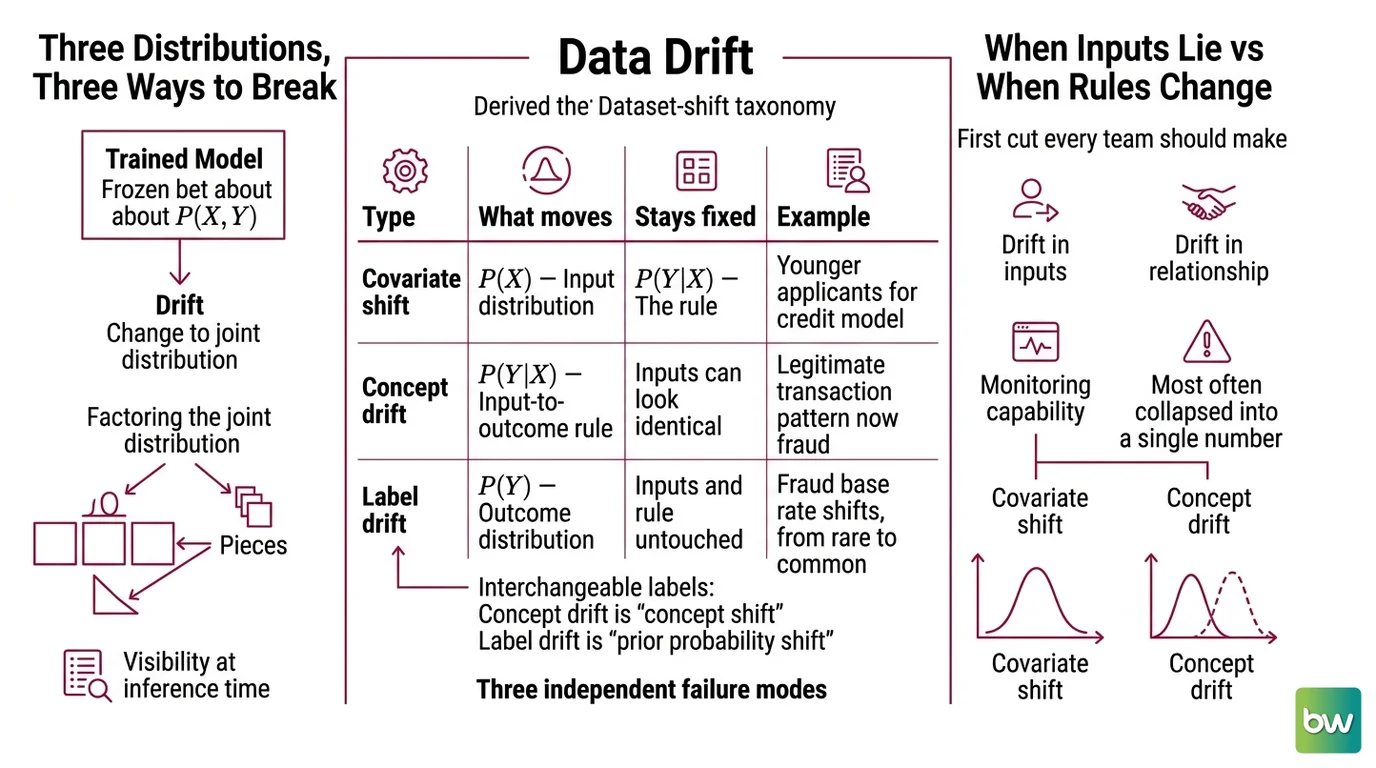
A trained model is a frozen bet about a joint distribution: the way inputs X and outcomes Y co-occur. Drift is any change to that joint distribution after the model was fitted. The useful move is to factor it, because the joint distribution splits into pieces — and only some of those pieces are visible from the data you collect at inference time.
What are the different types of data drift?
Data drift is an umbrella term for three mathematically separate shifts, formalized in the dataset-shift taxonomy of Moreno-Torres et al. Keeping them apart matters, because each one carries a different diagnosis and a different fix.
| Type | What moves | Stays fixed | Example |
|---|---|---|---|
| Covariate Shift | P(X) — the input distribution | P(Y|X) — the rule | A credit model starts seeing younger applicants than it trained on |
| Concept drift | P(Y|X) — the input-to-outcome rule | inputs can look identical | The same transaction pattern that meant “legitimate” now means “fraud” |
| Label Drift | P(Y) — the outcome distribution | inputs and rule may be untouched | Fraud goes from rare to common; the base rate shifts |
In the academic literature these carry stricter names: concept drift is “concept shift,” and label drift is “prior probability shift.” The labels are interchangeable; the distinction is not. Covariate shift moves the inputs, concept drift moves the relationship, label drift moves the outcomes.
Three letters in one equation, and three independent failure modes, not one.
When the Inputs Lie versus When the Rules Change
The first cut every team should make is between drift you can see in the inputs and drift you cannot. This is the distinction that decides whether your monitoring is even capable of catching the problem, and it is the one most often collapsed into a single number.
What is the difference between covariate shift and concept drift?
Covariate shift lives entirely in P(X). You can measure it with nothing but incoming feature values — no labels, no outcomes, no waiting. Compare last month’s input distribution to this month’s, and a divergence tells you the inputs moved.
Concept drift lives in P(Y|X), and that conditional hides the target Y. You cannot detect a change in the input-to-outcome rule by staring at inputs alone, because the inputs may be identical while the correct answer flips underneath them. Concept drift needs labels to confirm — actual outcomes, which often arrive late or never. A loan default reveals itself months after the prediction; a fraud label may wait on a chargeback or an investigation.
That asymmetry is the most consequential fact in drift detection. Covariate and label drift are observable from data you already hold; concept drift is inferred from outcomes you have to wait for. Treating a covariate-shift alarm as proof the model is wrong confuses a moved input with a broken rule — and the two demand different responses.
Not every input shift degrades accuracy. A model can absorb large covariate shift if the regions that moved are ones where its decision boundary was already stable.
The Statistics That Catch a Shift
Detecting drift means comparing two samples — a reference window from training or a healthy period, and a current window from live traffic — and asking whether they plausibly came from the same distribution. Three statistics do most of the work, and each makes a different trade-off between sensitivity and interpretability.
What statistics do you need to understand data drift detection?
The
Kolmogorov-Smirnov Test is a two-sample test for continuous variables. It measures the largest gap between the two empirical cumulative distribution functions and asks whether that gap exceeds what sampling noise would explain (scipy.stats.ks_2samp, per SciPy Docs). Its weakness is scale: on very large samples the test becomes over-sensitive, flagging trivial differences as statistically significant even when they carry no practical consequence.
The
Wasserstein Distance — the earth mover’s distance — measures the minimum “work” needed to reshape one distribution into the other (scipy.stats.wasserstein_distance, SciPy Docs). Unlike the KS statistic, it reflects how far the distribution moved, not merely that it moved, which makes it more useful as a magnitude than as a yes/no flag.
The Population Stability Index ( Population Stability Index) bins both distributions and sums a weighted log-ratio of the bin proportions. A long-standing industry convention reads PSI below 0.1 as no meaningful drift, 0.1 to 0.25 as moderate, and above 0.25 as significant enough to consider retraining (Fiddler AI). Treat those cutoffs as a rule of thumb, not a law — there is no universally accepted threshold, and the right value is application-specific.
For categorical features and probability outputs, KL Divergence and its symmetric relative, Jensen–Shannon divergence, measure how far one distribution sits from another in information terms.
Notice the pattern. Every one of these compares a marginal distribution — movement in P(X) or P(Y). None of them, on its own, sees P(Y|X), the conditional that defines concept drift. That is not a coincidence; it is a limit of the data they operate on.
Reading the Drift Before Accuracy Drops
Once you separate the three shifts, drift detection turns from a single alarm into a small diagnostic tree. The statistic tells you that something moved; the type tells you what it means and what to do about it.
- If feature statistics drift but live accuracy holds, you are seeing covariate shift the model absorbs — log it, watch it, but resist retraining on noise.
- If inputs look stable yet accuracy falls, suspect concept drift — and accept that confirming it requires labels, not more feature monitoring.
- If your input distributions and decision rule look untouched but calibrated thresholds start misfiring, check P(Y): label drift can wreck a threshold even when the model itself is fine.
This is where tooling enters. Several libraries implement these comparisons so you do not hand-roll them. Evidently AI offers the widest test suite. NannyML takes a different angle: it estimates model performance without labels, using its CBPE and DLE algorithms to approximate accuracy before ground truth arrives (NannyML on PyPI) — a partial workaround for the concept-drift blind spot. Alibi Detect ships a large detector zoo, and Whylogs handles the data profiling that feeds drift visualization, usually through the WhyLabs platform rather than the library alone.
Tooling notes (versions current as of June 2026):
- Evidently (0.7.21): Apache-2.0 open-source; 20+ statistical tests including KS, PSI, and Wasserstein (Evidently on PyPI).
- NannyML (0.13.1): open-source; estimates performance without labels via CBPE/DLE (NannyML on PyPI). Active development has shifted toward the commercial NannyML Cloud.
- Alibi Detect (0.13.0): licensed under Business Source License 1.1 — source-available, not open-source. Free for non-production use only; production use requires a commercial license (Alibi Detect on PyPI).
Drift detection is one signal inside the wider discipline of Model Monitoring, which also tracks live performance, data quality, and operational health. Drift is a leading indicator — it can warn you before accuracy falls — but a drift score is not a verdict on the model. When drift is confirmed and performance is genuinely affected, the usual response is Model Retraining on data that reflects the new distribution.
Rule of thumb: match the statistic to the question — KS or Wasserstein for continuous inputs, PSI for binned features and scores, and label-free performance estimation when outcomes lag.
When it breaks: the entire input-monitoring stack is blind to concept drift, because P(Y|X) depends on the target. A model can keep receiving perfectly in-distribution inputs while the correct answer shifts beneath them, and every feature-based detector will report green until the labels finally arrive and confirm the damage.
The Data Says
Data drift is not one phenomenon but three — covariate, concept, and label — separated by which part of the joint distribution moves. Tests like KS, Wasserstein, and PSI reliably catch shifts in the inputs and the outputs, but the most dangerous shift, the one in the input-to-output rule, stays invisible until ground truth catches up. Detection tells you which part of the distribution moved; only outcomes tell you whether it mattered.
AI-assisted content, human-reviewed. Images AI-generated. Editorial Standards · Our Editors