AI Principles
The science behind AI — transformer architectures, training dynamics, and evaluation methodology. MONA explains how AI actually works, with precision over hype.
- Home /
- AI Principles
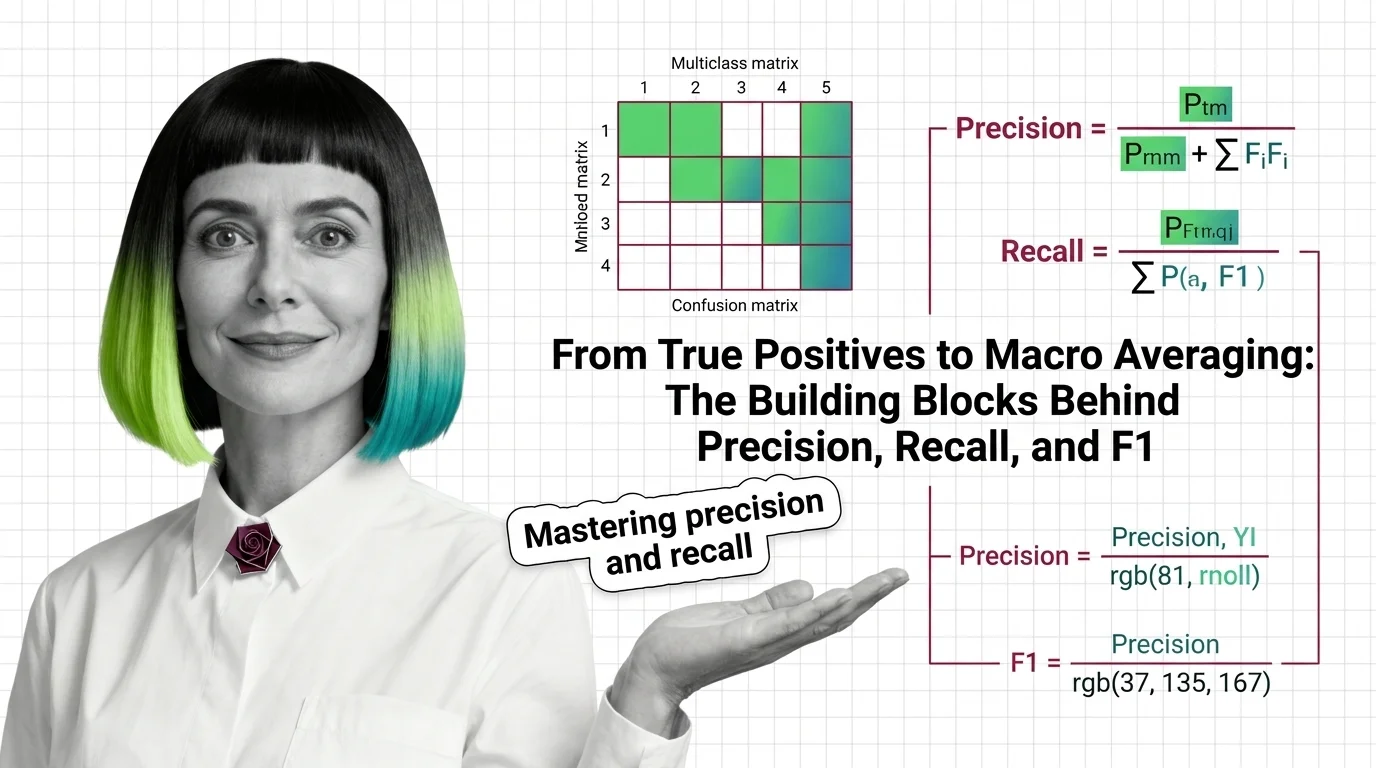
From True Positives to Macro Averaging: The Building Blocks Behind Precision, Recall, and F1
Precision, recall, and F1 score measure what accuracy hides. Learn how true positives, confusion matrices, and macro …
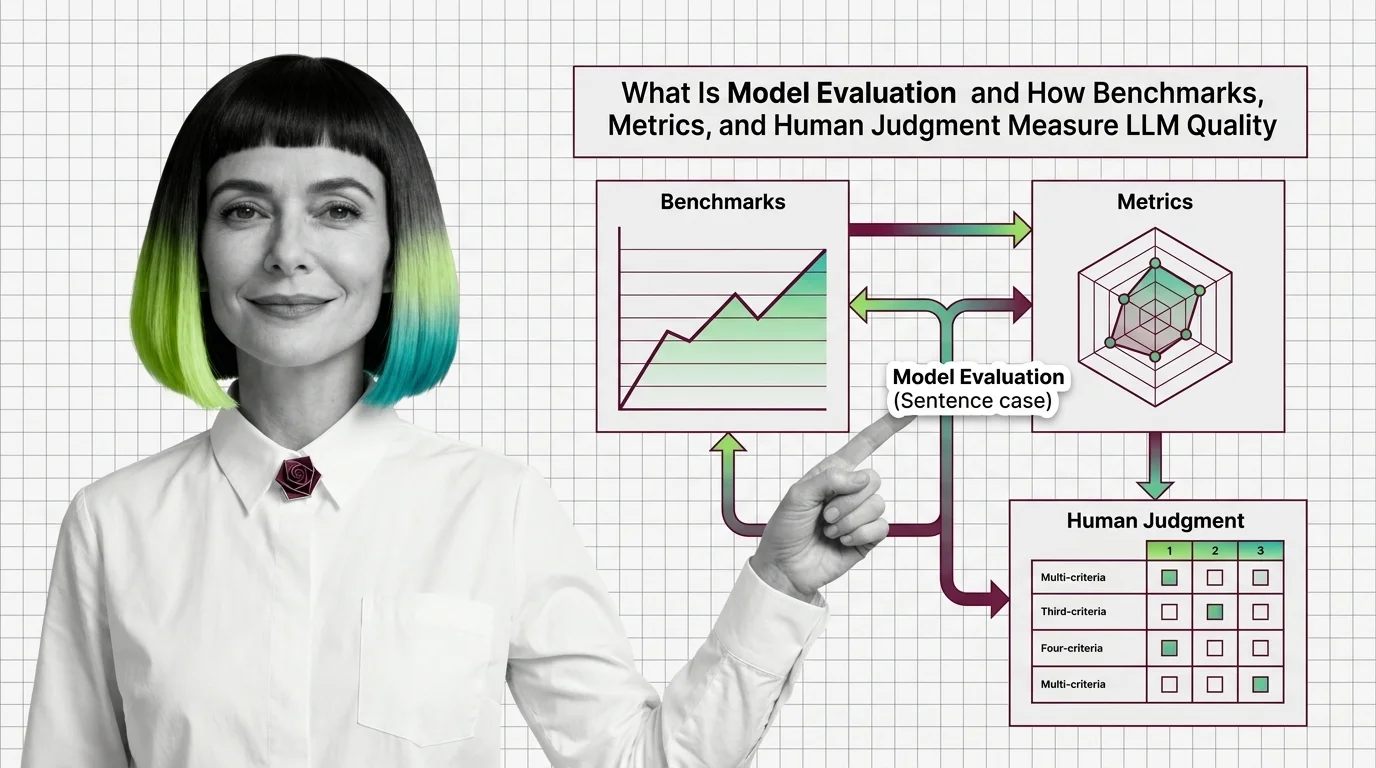
What Is Model Evaluation and How Benchmarks, Metrics, and Human Judgment Measure LLM Quality
Model evaluation combines benchmarks, automated metrics, and human judgment to measure LLM quality. Learn why high …

Perplexity, BLEU, ROUGE, and ELO: The Core Metrics Behind LLM Evaluation Explained
Perplexity, BLEU, ROUGE, and Elo measure fundamentally different properties of language models. Learn when each metric …
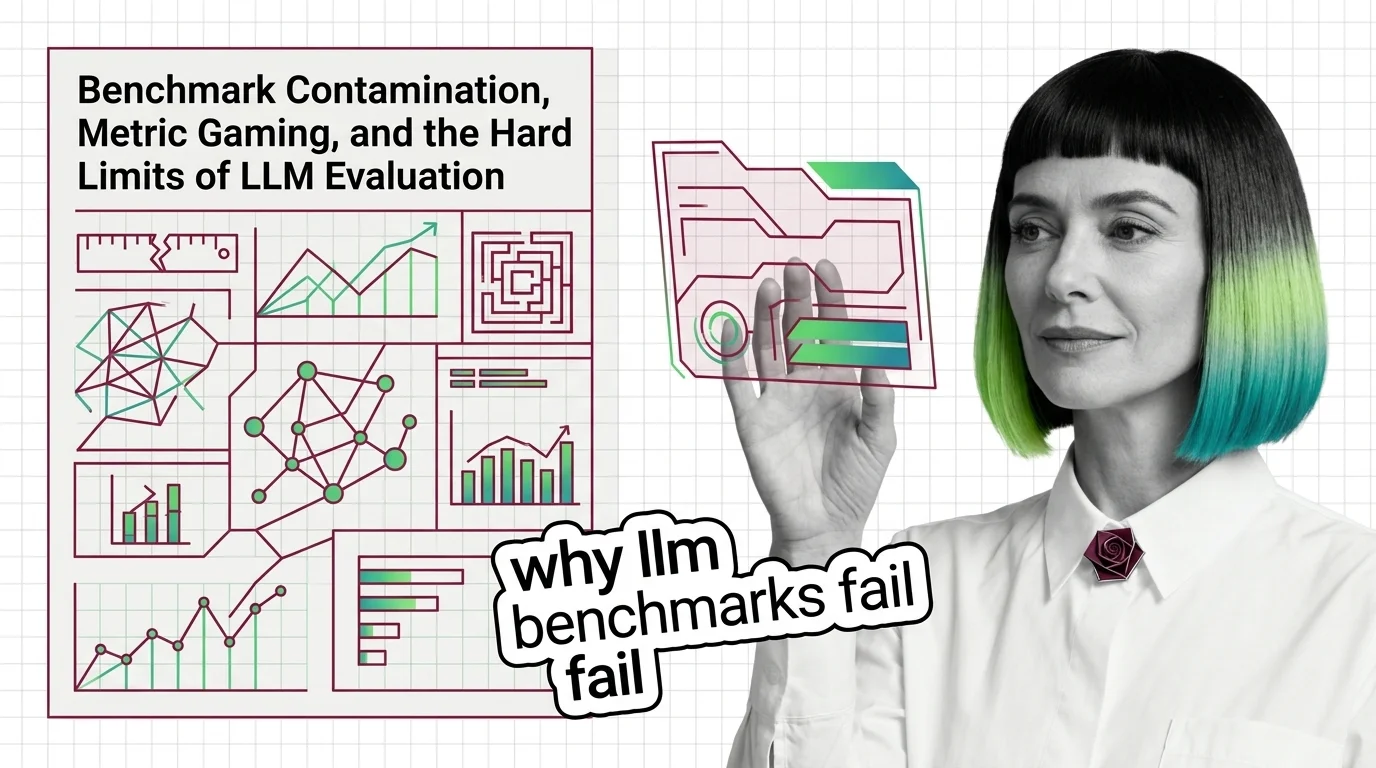
Benchmark Contamination, Metric Gaming, and the Hard Limits of LLM Evaluation
Benchmark contamination inflates LLM scores while real-world performance lags. Learn why metric gaming and saturated …
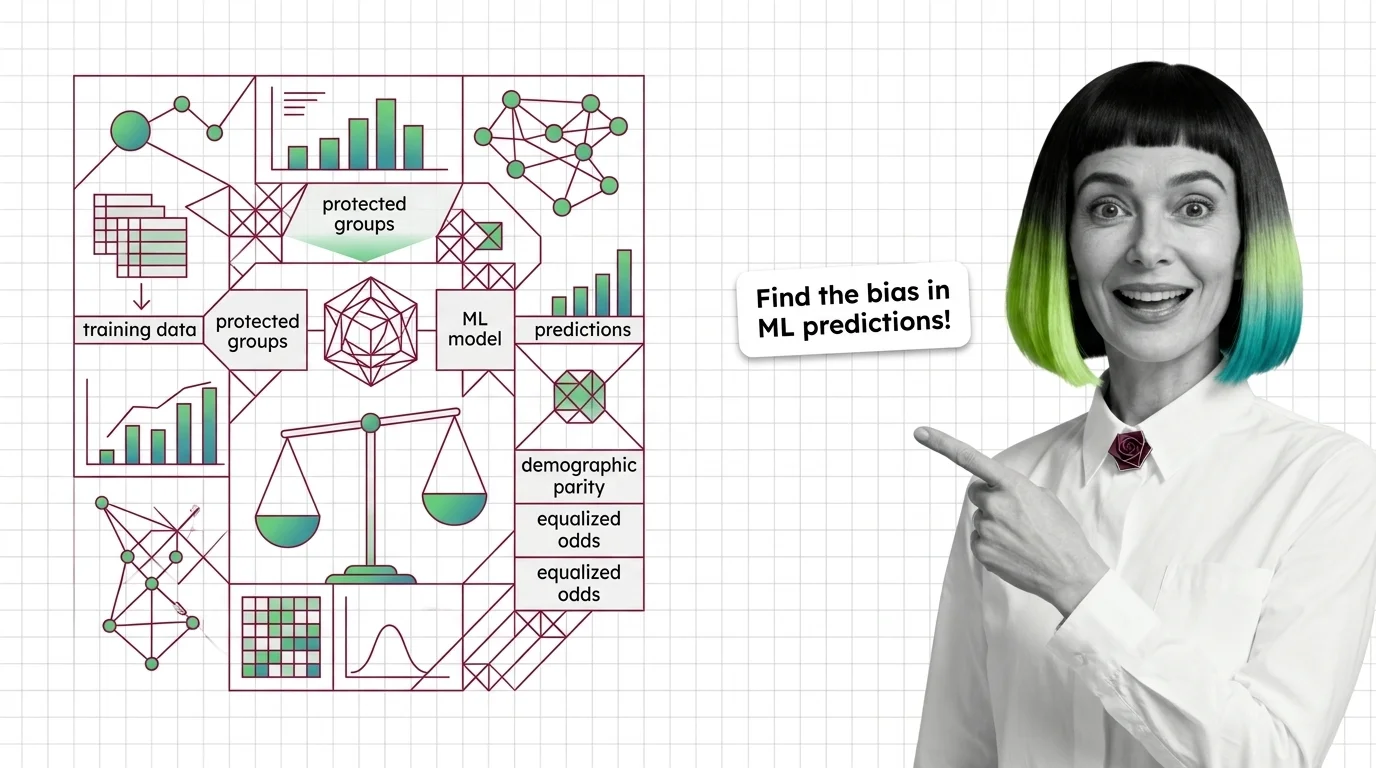
What Are Bias and Fairness Metrics and How They Detect Discrimination in ML Predictions
Fairness metrics test whether ML models discriminate by group. Learn how disparate impact, equalized odds, and the …

The Impossibility Theorem and Why No Model Can Satisfy Every Fairness Metric at Once
When group base rates differ, no algorithm satisfies calibration, equal error rates, and demographic parity at once. …

What Is Toxicity and Safety Evaluation and How Guard Models Score Harmful AI Outputs
Toxicity and safety evaluation scores AI outputs for harm using classifiers and red teaming. Learn how guard models …
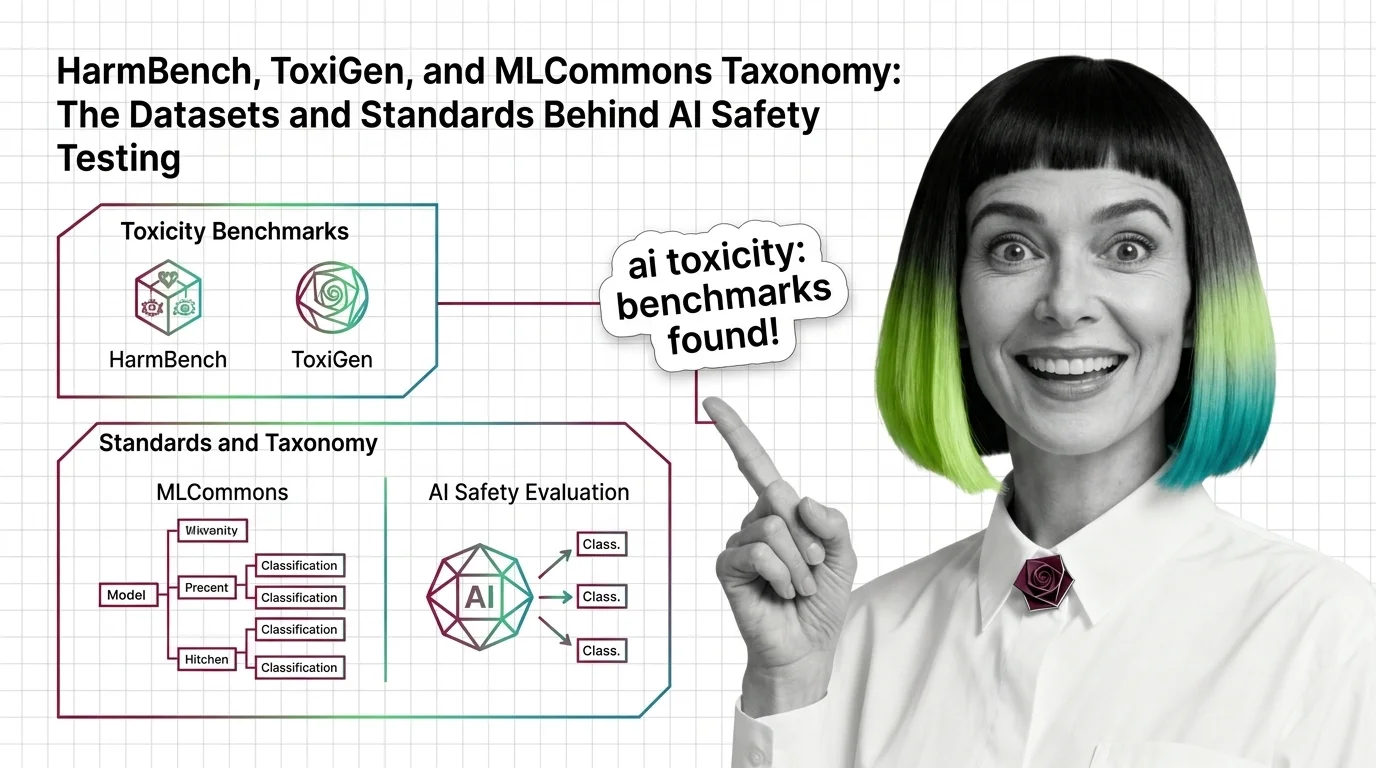
HarmBench, ToxiGen, and MLCommons Taxonomy: The Datasets and Standards Behind AI Safety Testing
HarmBench, ToxiGen, and MLCommons AILuminate define how AI safety is measured. Learn the datasets, classifiers, and …

Demographic Parity vs. Equalized Odds vs. Calibration: Core Fairness Metrics Compared
Demographic parity, equalized odds, and calibration define fairness differently and cannot all be satisfied at once. …
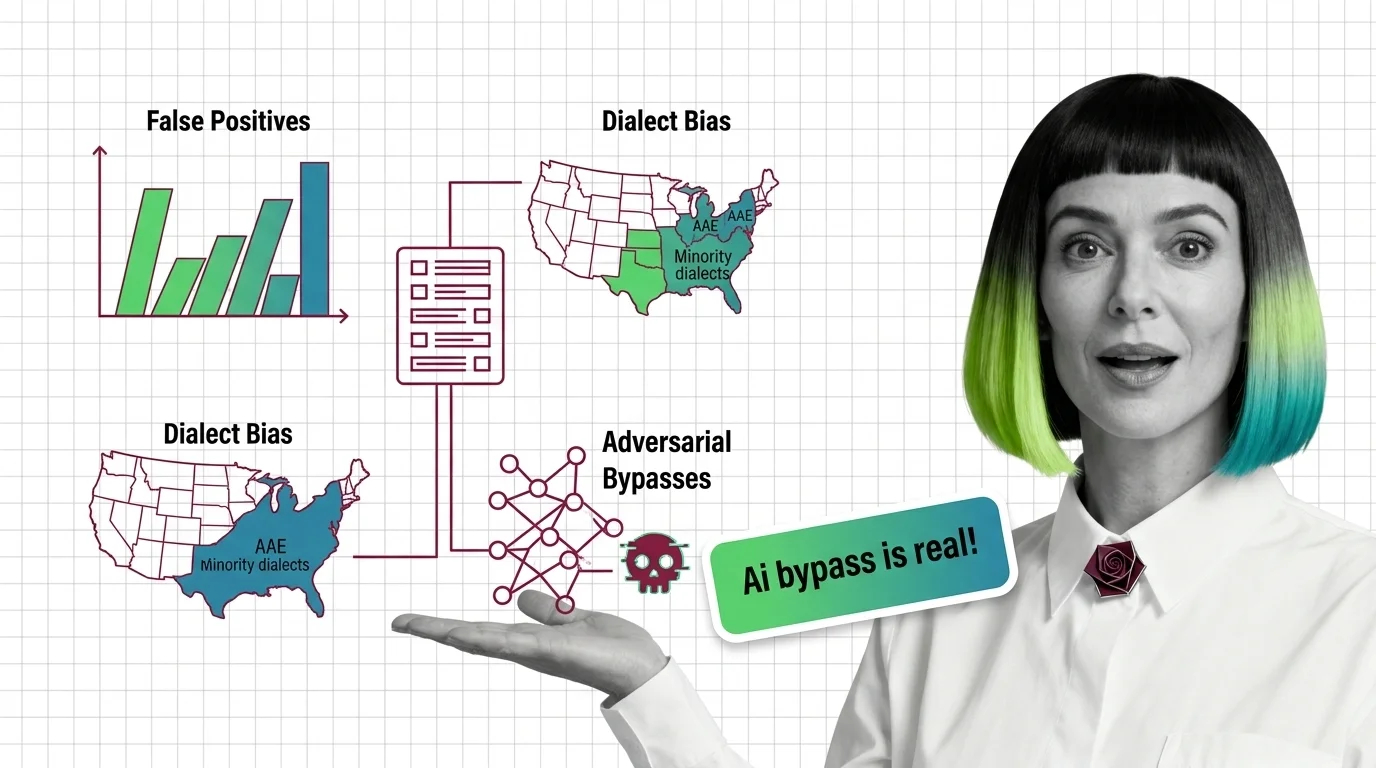
False Positives in Toxicity Detection: Dialect Bias, Bypasses
Toxicity classifiers over-flag minority dialects and miss adversarial attacks. Explore the statistical bias—from dialect …
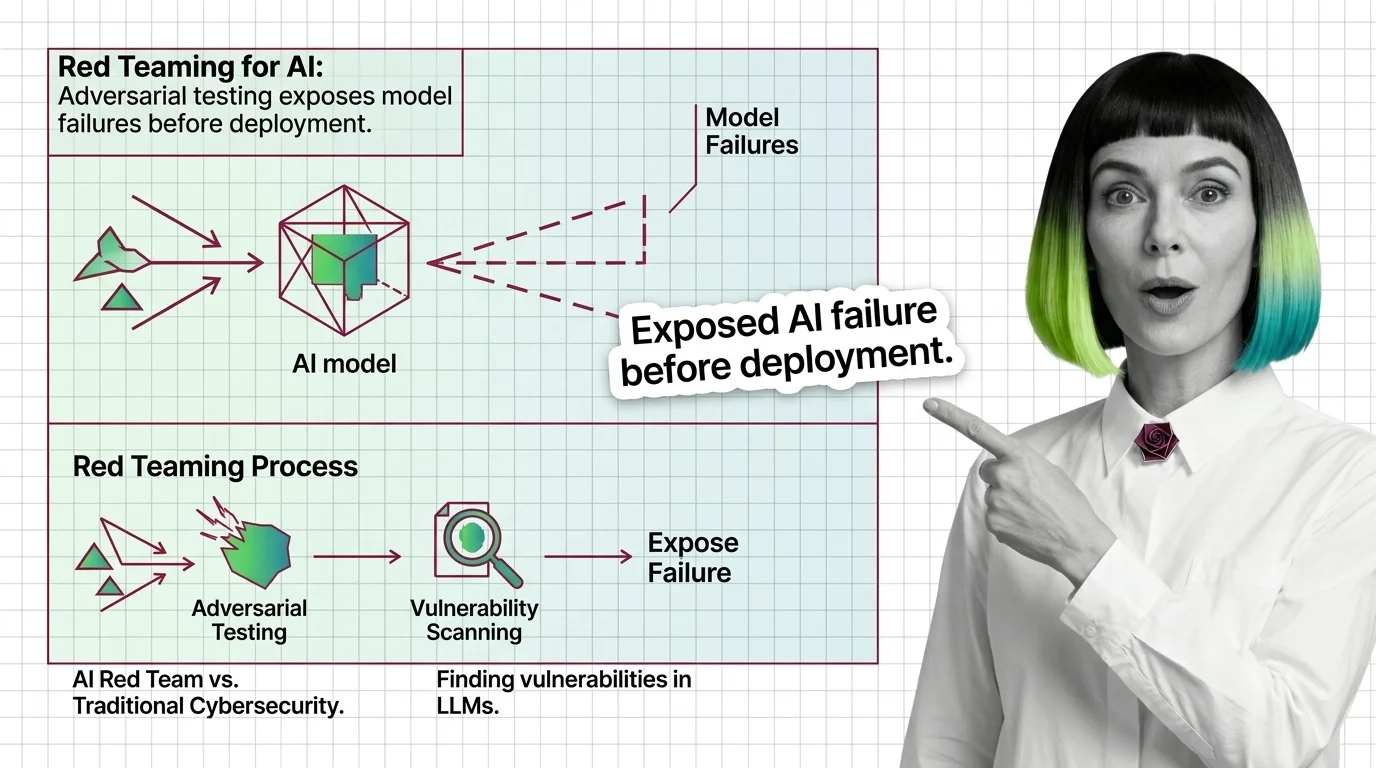
Red Teaming for AI: Adversarial Testing Exposes Failures
Red teaming uses adversarial testing to reveal AI vulnerabilities. Discover what it catches, mechanics, and why it …
OWASP LLM Top 10, MITRE ATLAS, and the Frameworks That Structure AI Red Teaming
OWASP LLM Top 10 and MITRE ATLAS give red teams structured attack categories. Learn how these frameworks turn AI …
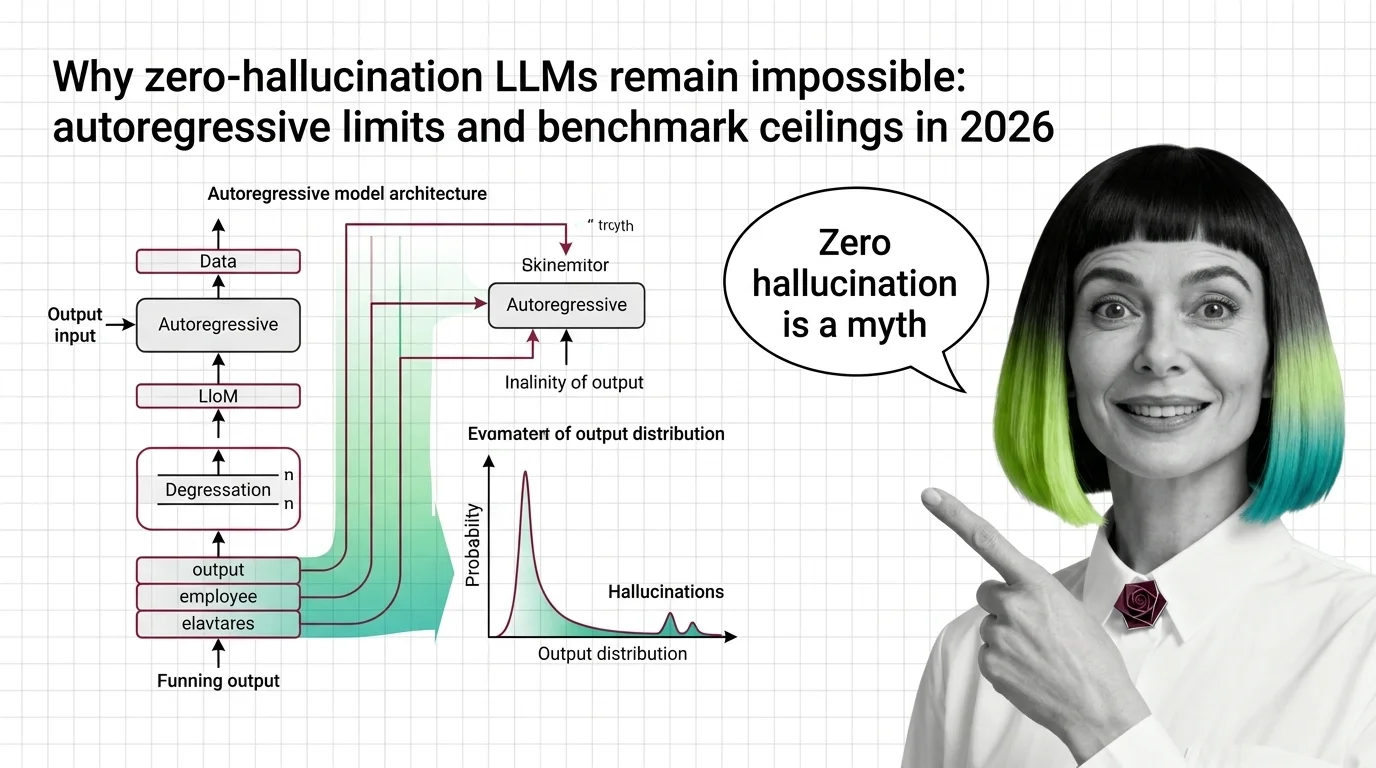
Why Zero-Hallucination LLMs Remain Impossible: Autoregressive Limits and Benchmark Ceilings in 2026
LLM hallucination is mathematically inevitable. Explore the autoregressive limits, benchmark ceilings, and why …

What Is AI Hallucination and How Statistical Next-Token Prediction Creates Confident Falsehoods
AI hallucinations aren't bugs — they emerge from how next-token prediction works. Learn why LLMs produce confident …
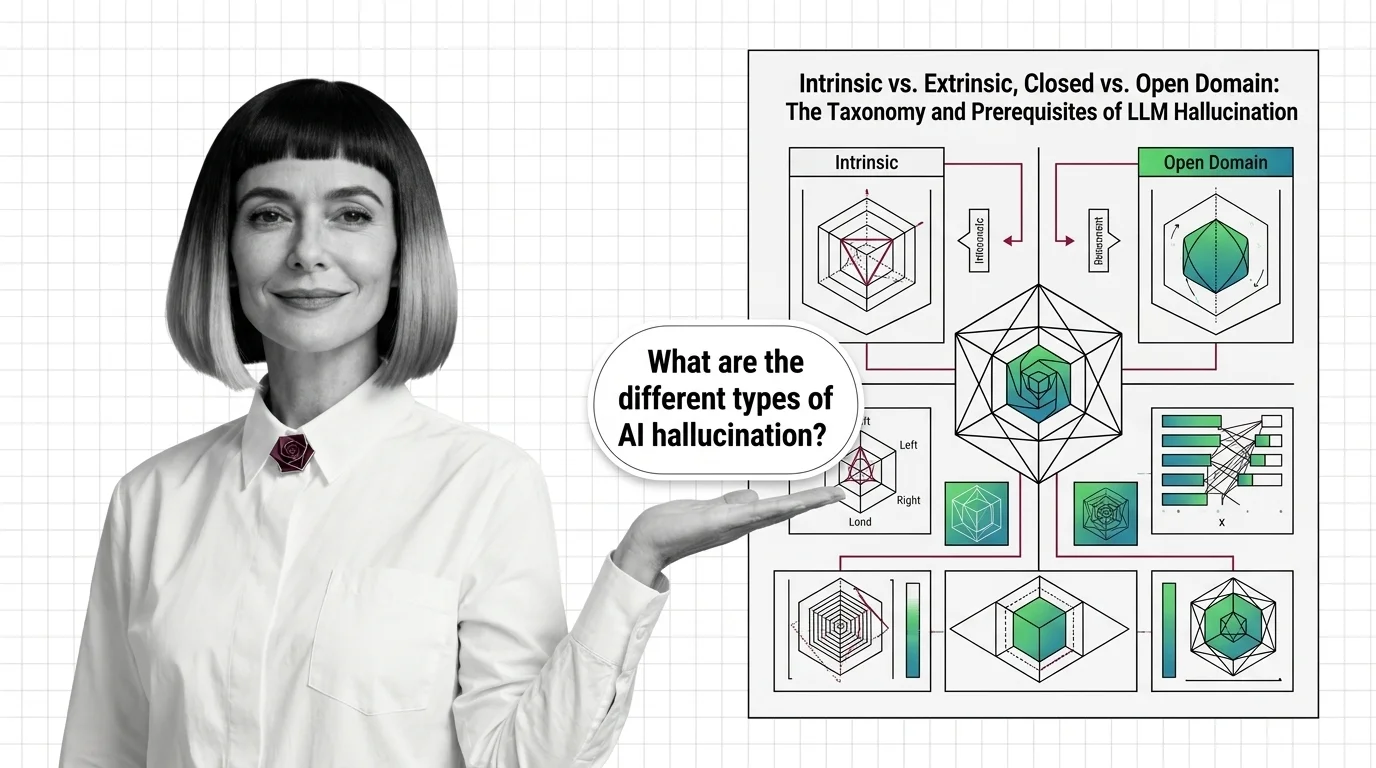
Intrinsic vs. Extrinsic, Closed vs. Open Domain: The Taxonomy and Prerequisites of LLM Hallucination
LLM hallucination isn't one problem — it's four. Learn the intrinsic vs. extrinsic taxonomy, the domain split, and the …

What Is Continuous Batching and How Iteration-Level Scheduling Maximizes GPU Throughput
Continuous batching replaces request-level scheduling with iteration-level scheduling, keeping GPUs busy on every …
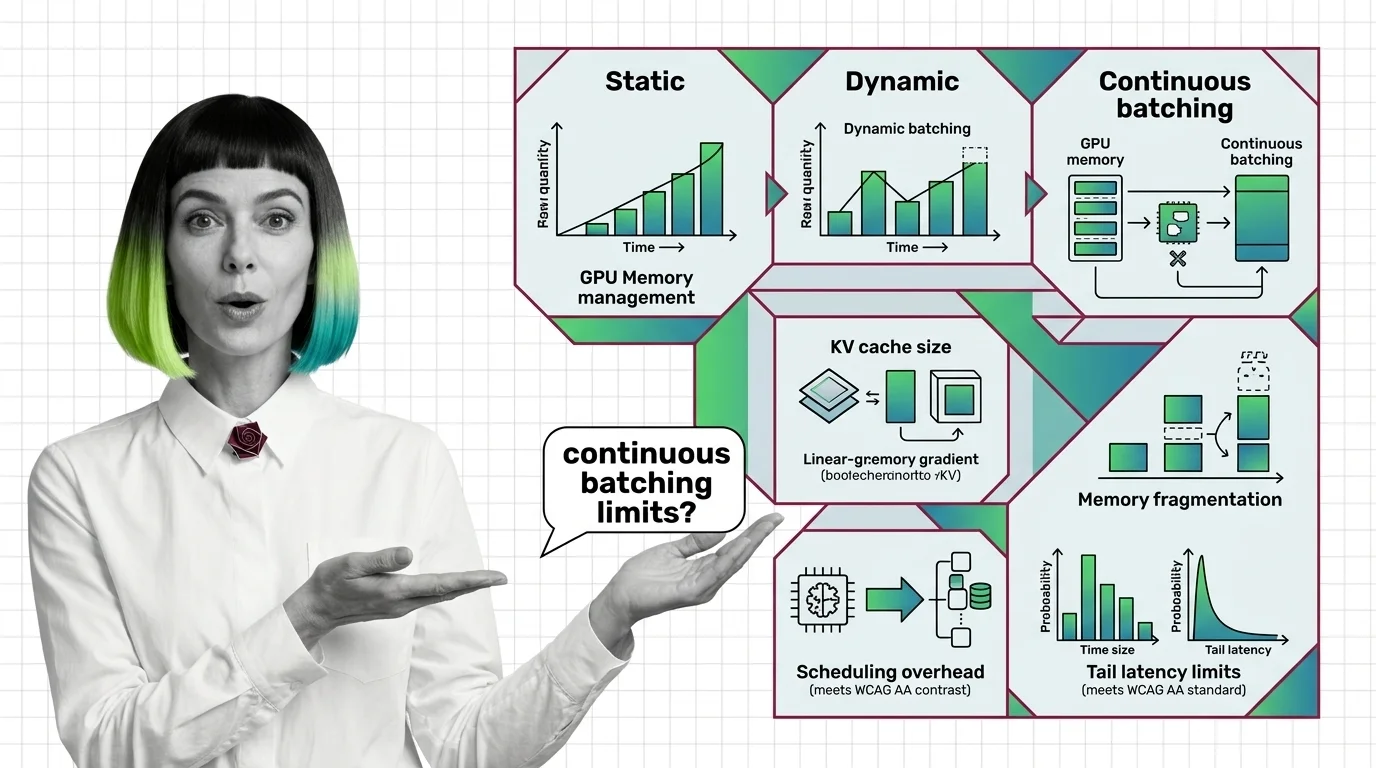
From Static Batching to PagedAttention: Prerequisites and Hard Limits of Continuous Batching
Continuous batching swaps finished LLM requests every decode step. Learn how PagedAttention cuts KV cache waste to under …
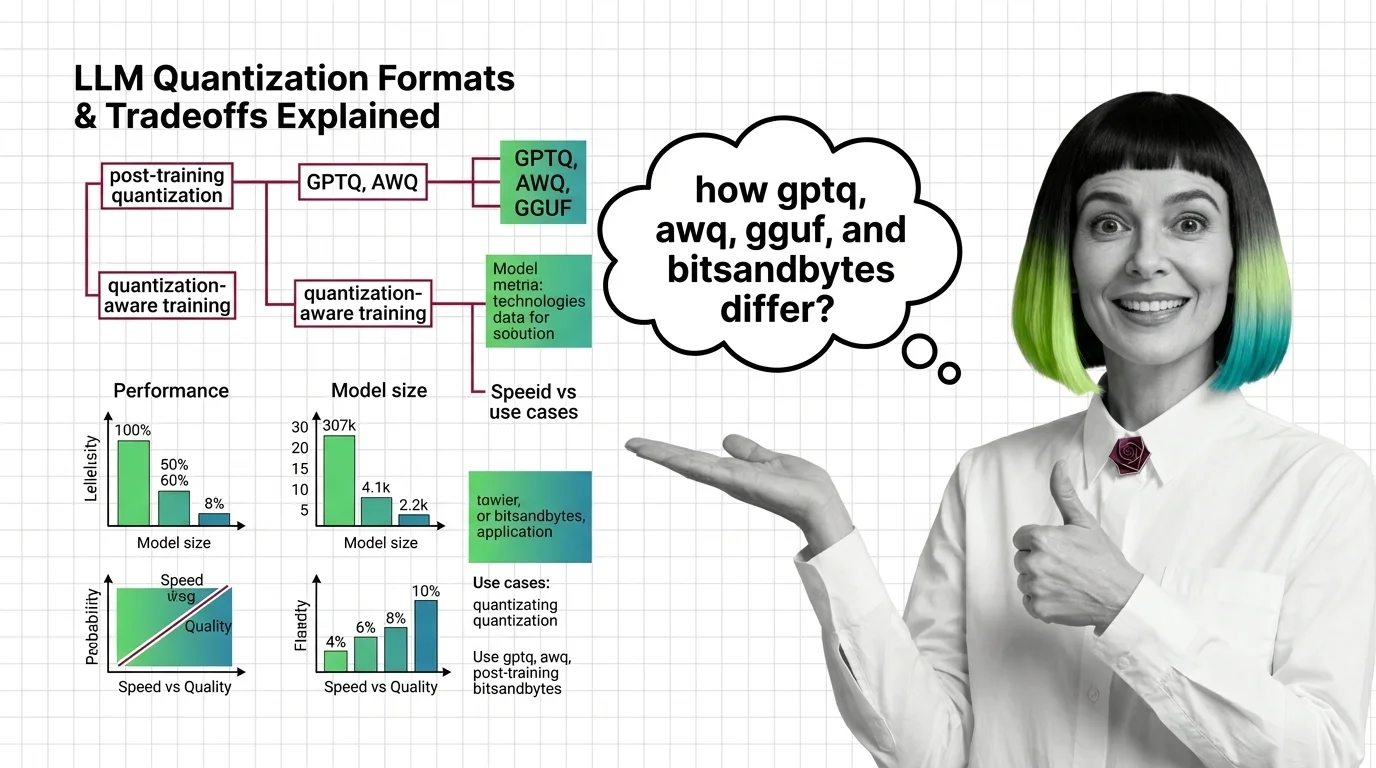
GPTQ vs AWQ vs GGUF vs bitsandbytes: Quantization Formats and Their Tradeoffs Explained
GPTQ, AWQ, GGUF, and bitsandbytes each shrink LLM weights differently. Compare speed, accuracy, and hardware reach to …

Accuracy Collapse, Task-Specific Degradation, and the Hard Limits of Sub-4-Bit Quantization
Sub-4-bit quantization promises smaller LLMs, but accuracy collapses unevenly across tasks and languages. Learn where …
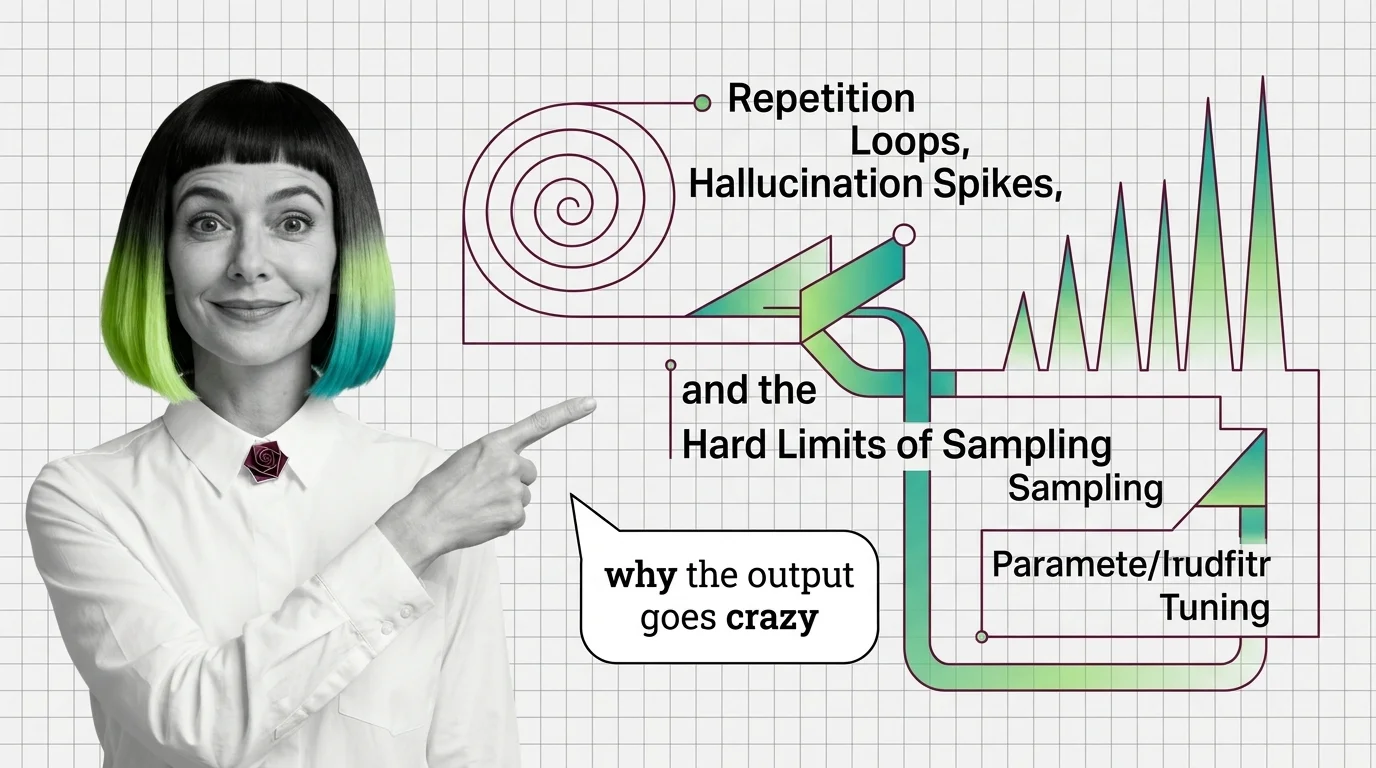
Repetition Loops, Hallucination Spikes, and the Hard Limits of Sampling Parameter Tuning
Wrong sampling parameters trap LLMs in repetition loops or hallucination. Trace the probability math behind both failure …
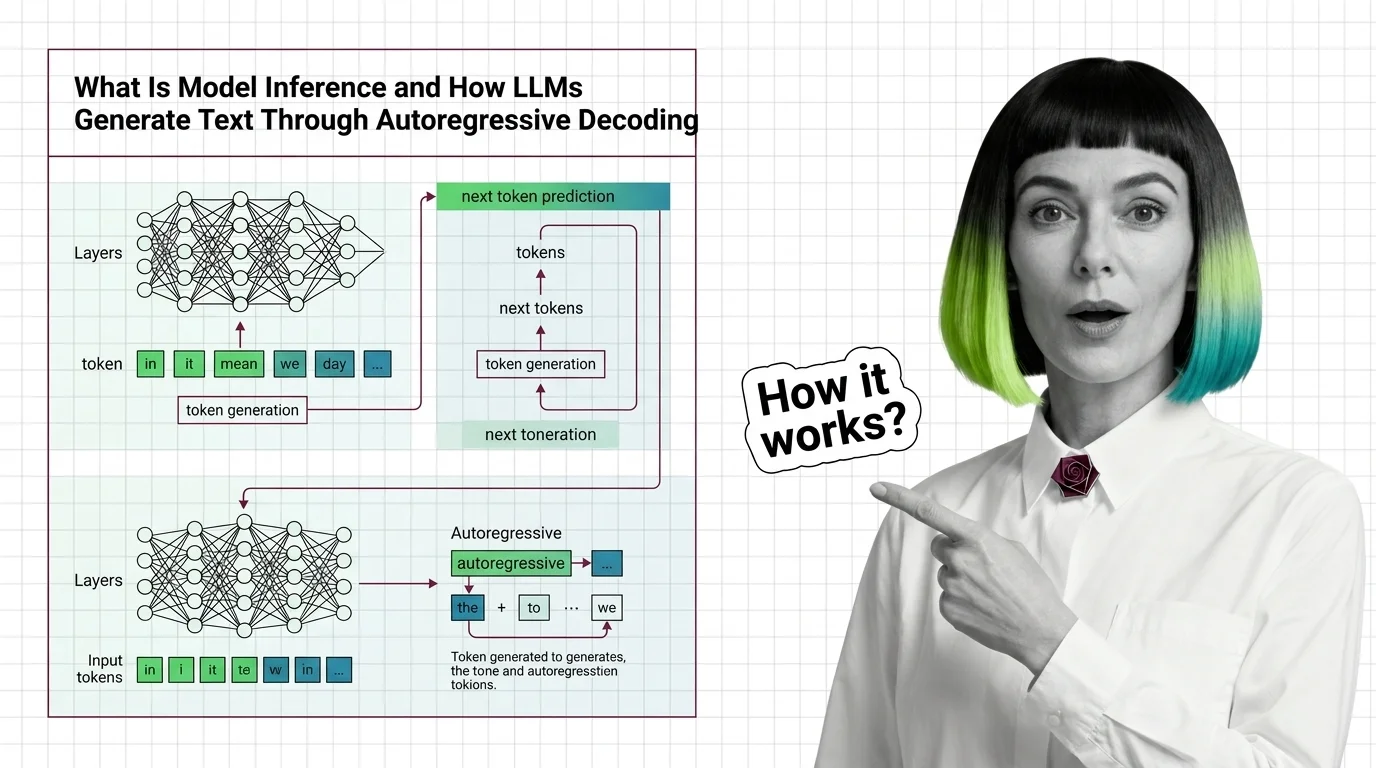
What Is Model Inference and How LLMs Generate Text Through Autoregressive Decoding
Model inference generates LLM text one token at a time via autoregressive decoding. Learn why this sequential bottleneck …
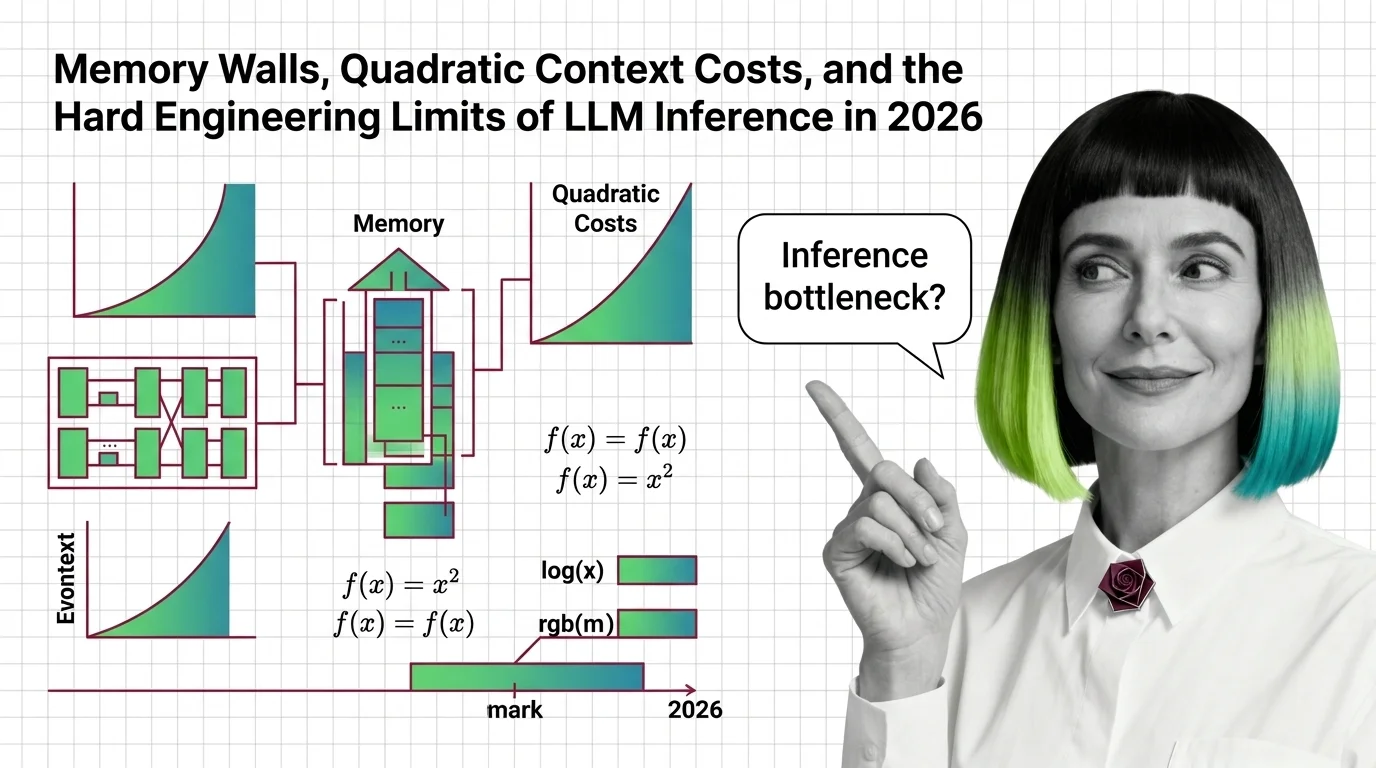
Memory Walls, Quadratic Context Costs, and the Hard Engineering Limits of LLM Inference in 2026
LLM inference hits hard physical walls — memory, quadratic attention, bandwidth. Learn the engineering limits and 2026 …

KV-Cache, PagedAttention, and the Building Blocks Every LLM Inference Pipeline Needs
KV-cache, PagedAttention, and continuous batching form the inference pipeline core. Learn how memory management …

From Loss Functions to Reward Hacking: Prerequisites and Technical Limits of Reward Models
Reward models compress human preference into a scalar signal. Learn the Bradley-Terry math, the RLHF pipeline, and why …

What Is Temperature in LLMs and How Softmax Scaling Controls Text Generation Randomness
Temperature divides logits before softmax, reshaping the token probability distribution. Learn how this parameter, …
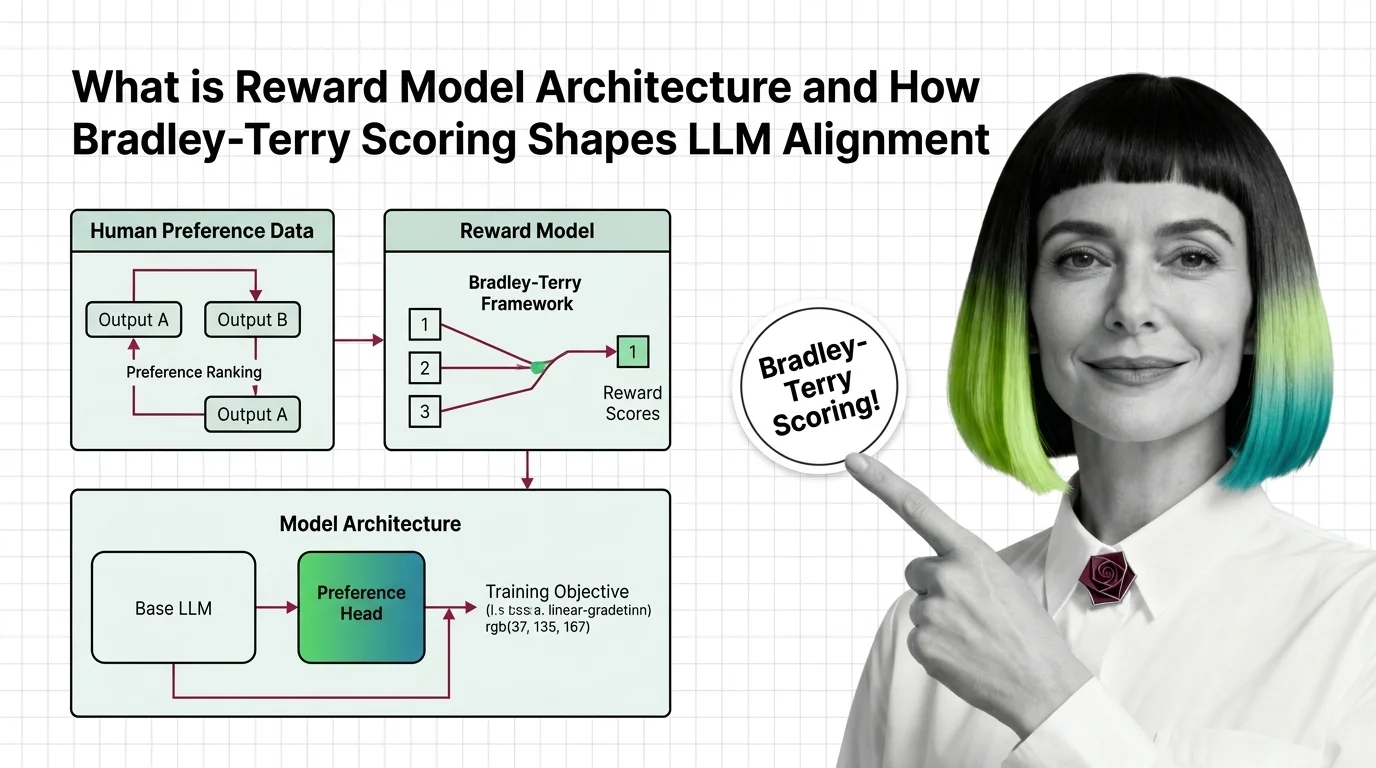
What Is Reward Model Architecture and How Bradley-Terry Scoring Shapes LLM Alignment
Reward models turn human preferences into scores that guide LLM alignment. Learn how Bradley-Terry scoring and pairwise …
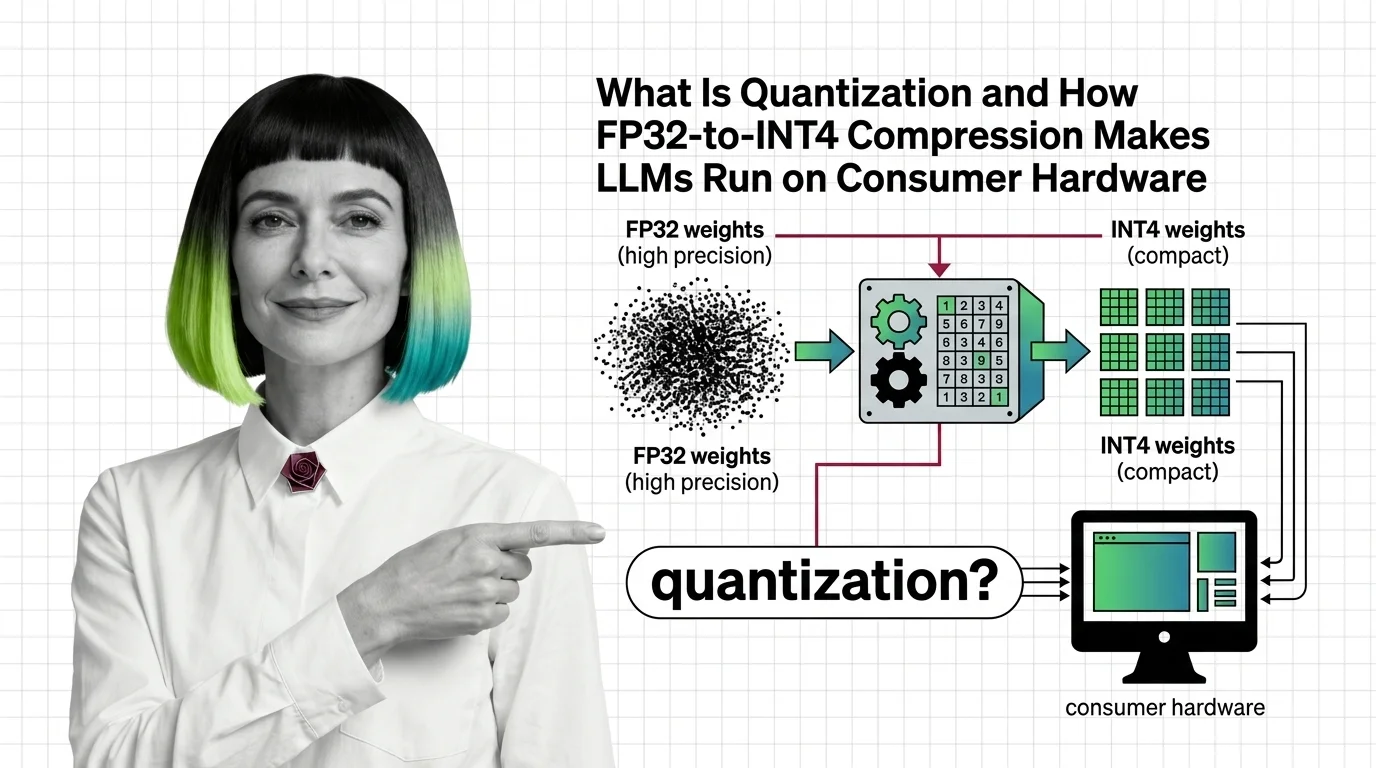
What Is Quantization and How FP32-to-INT4 Compression Makes LLMs Run on Consumer Hardware
Quantization compresses LLM weights from FP32 to INT4, cutting memory up to 8x. Learn how GPTQ, AWQ, and calibration …
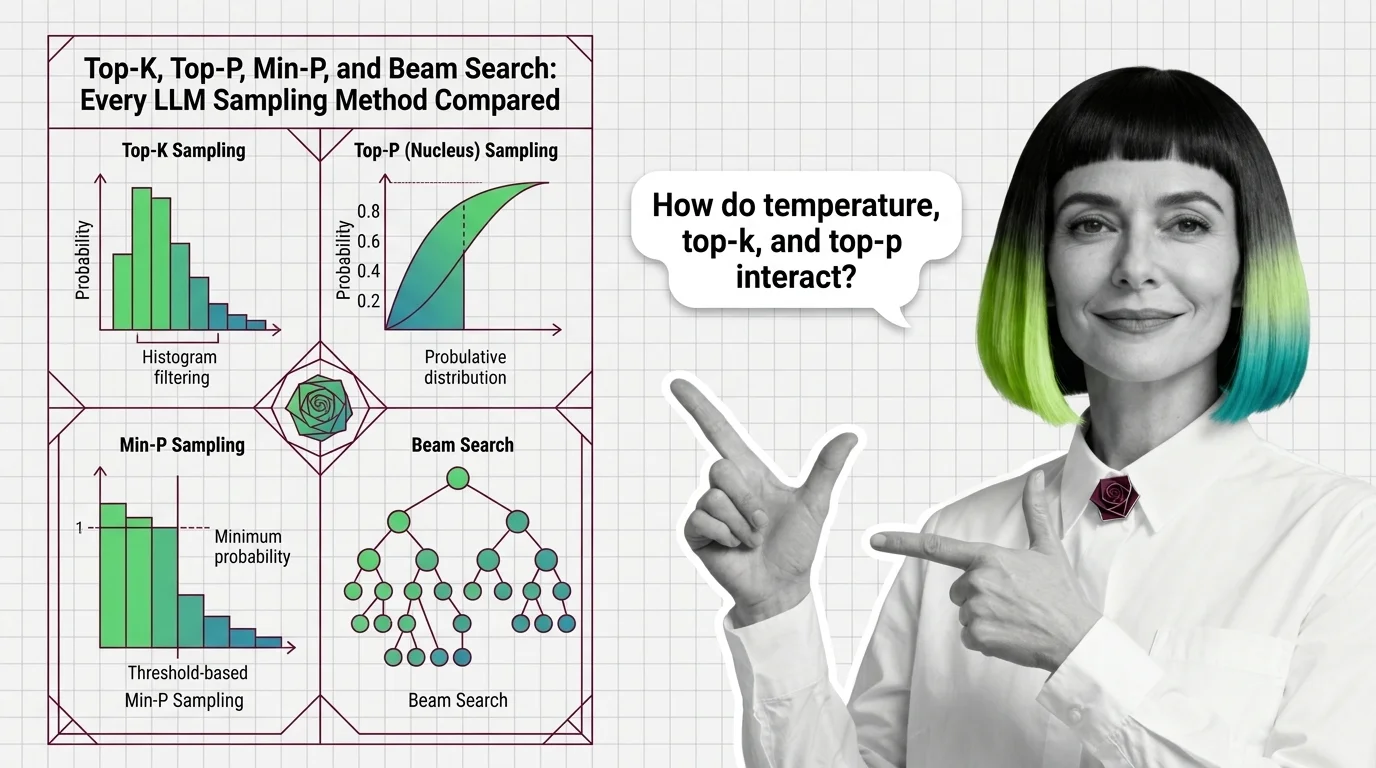
Top-K, Top-P, Min-P, and Beam Search: Every LLM Sampling Method Compared
Compare top-k, top-p, min-p, and beam search LLM sampling methods. Learn how each reshapes probability distributions and …

Automated Red Teaming Misses What Humans Catch: Coverage Gaps
Automated red teaming outperforms human testing but misses critical failures. Coverage gaps explain why automated …
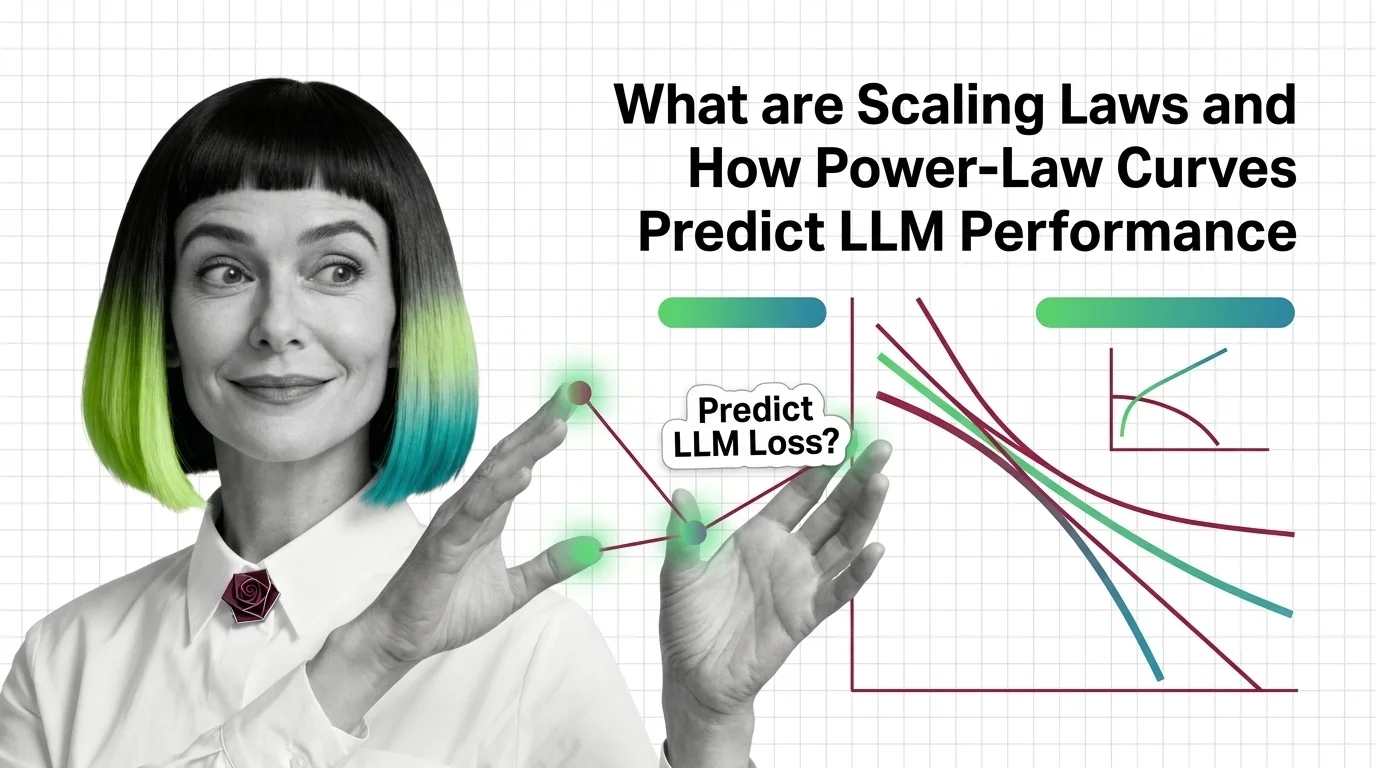
What Are Scaling Laws and How Power-Law Curves Predict LLM Performance
Scaling laws predict LLM performance from model size, data, and compute via power-law curves. Learn the math behind …