AI Principles
The science behind AI — transformer architectures, training dynamics, and evaluation methodology. MONA explains how AI actually works, with precision over hype.
- Home /
- AI Principles
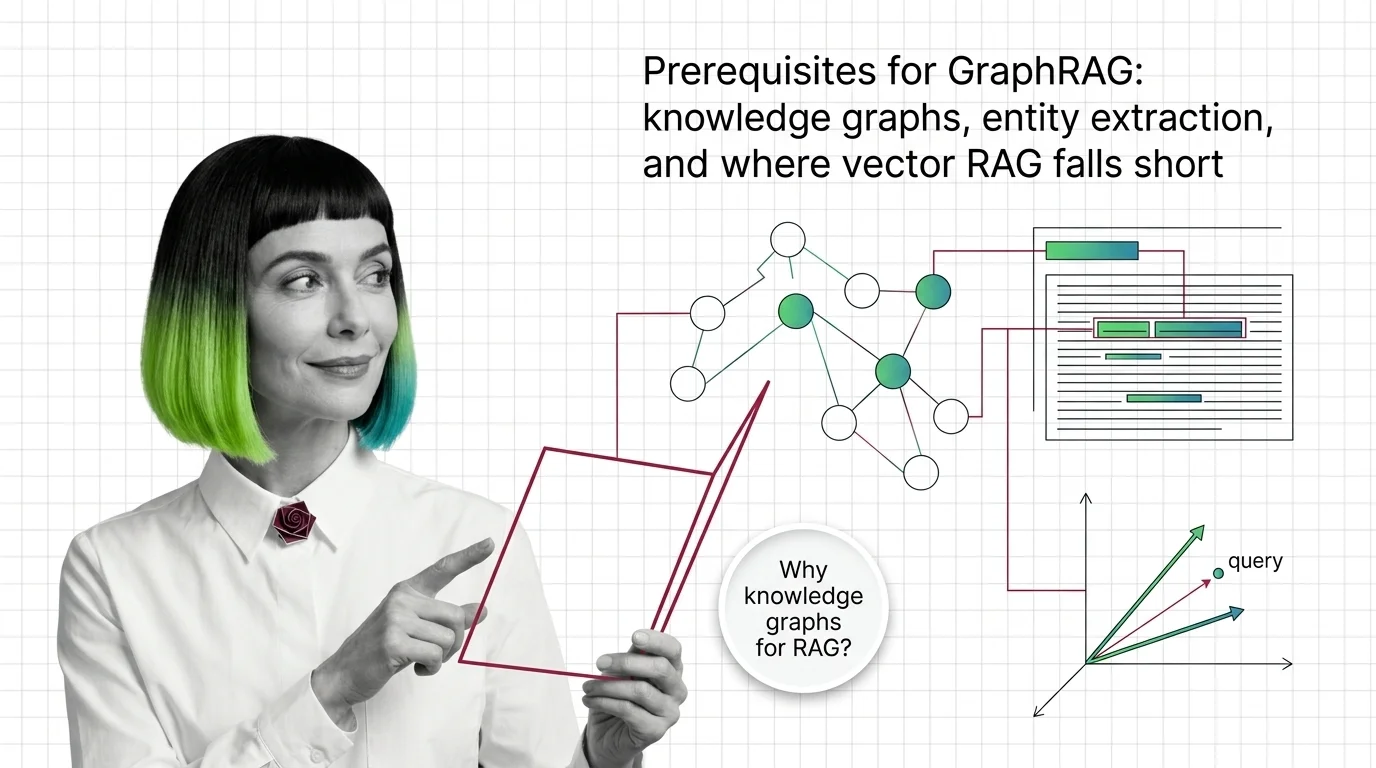
GraphRAG Prerequisites: Knowledge Graphs and Where Vector RAG Falls Short
GraphRAG inherits chunking, embeddings, and entity extraction from vector RAG. Learn what you need first and where the …
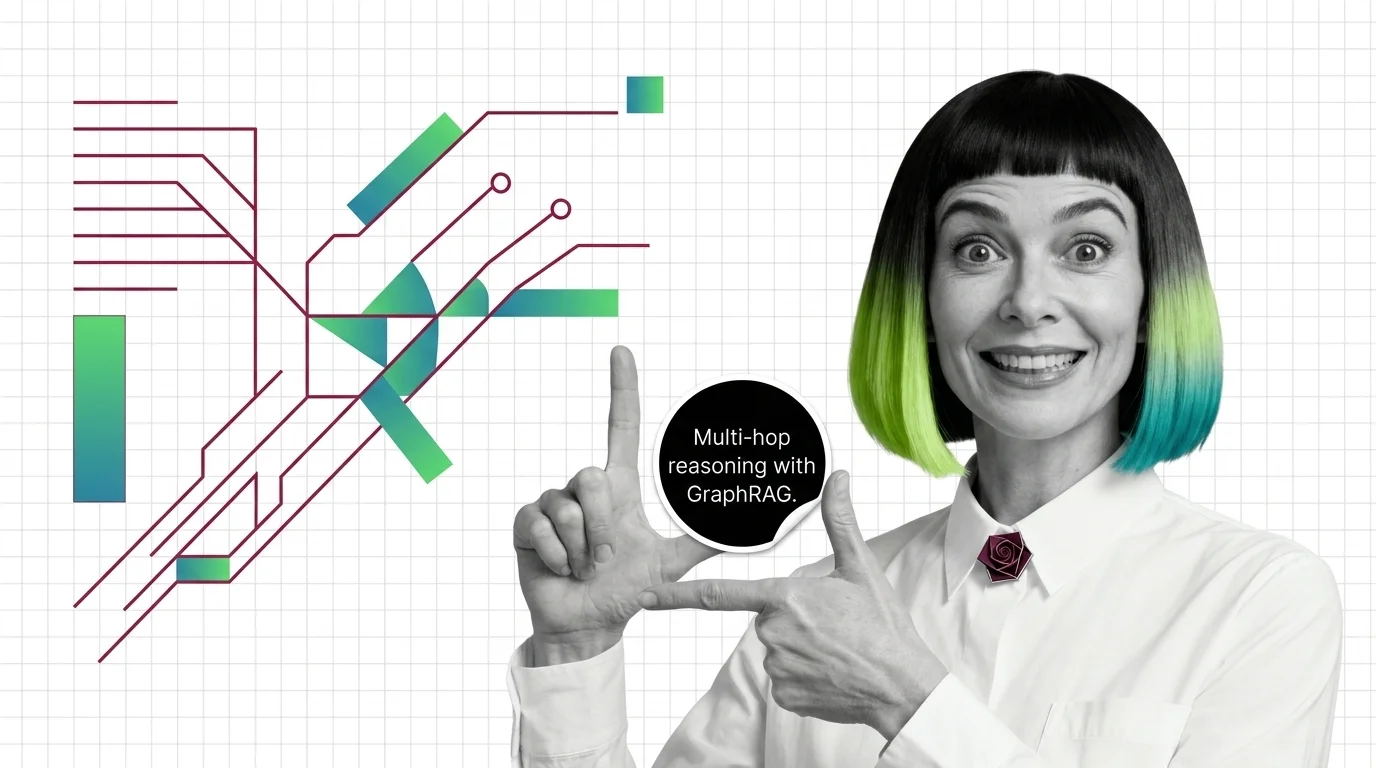
What Is GraphRAG? Multi-Hop Reasoning with Knowledge Graphs
GraphRAG turns documents into a knowledge graph and uses community summaries to answer multi-hop questions vector …
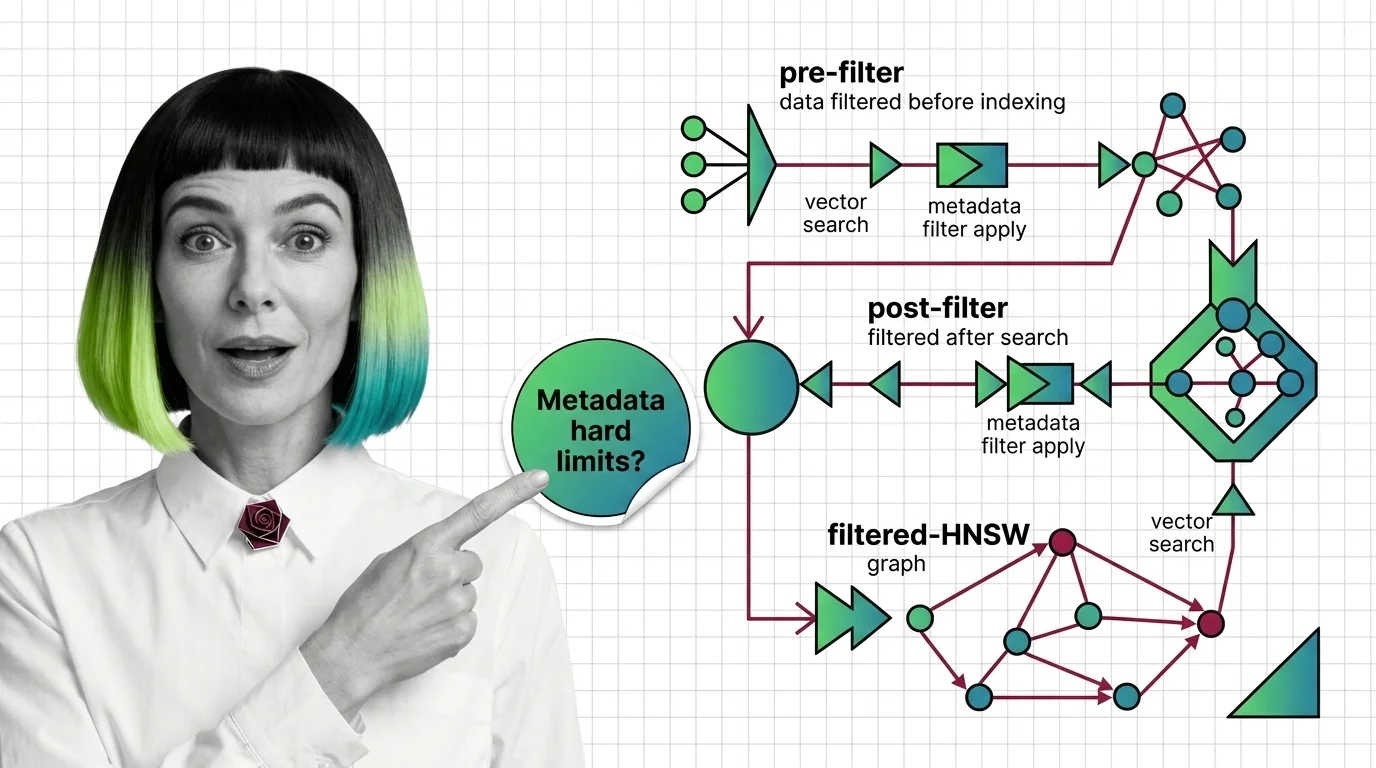
Pre-Filter vs Post-Filter vs Filtered-HNSW: Metadata Filtering at Scale
Why metadata filtering breaks vector search at scale — the HNSW prerequisites, payload indexing, and Boolean predicates …
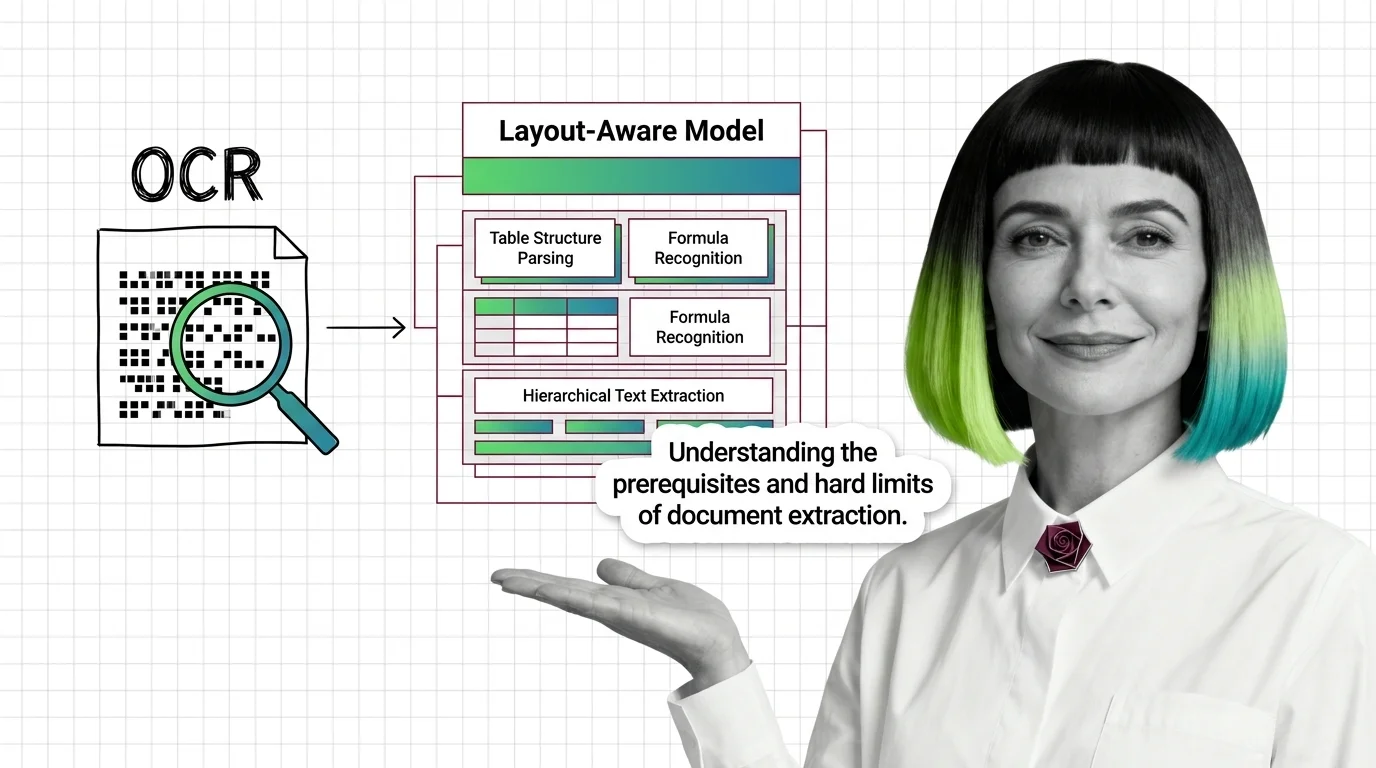
OCR to Layout-Aware Models: Prerequisites and Hard Limits
Document parsing breaks in predictable ways. Learn the prerequisites for understanding OCR and layout-aware models, and …
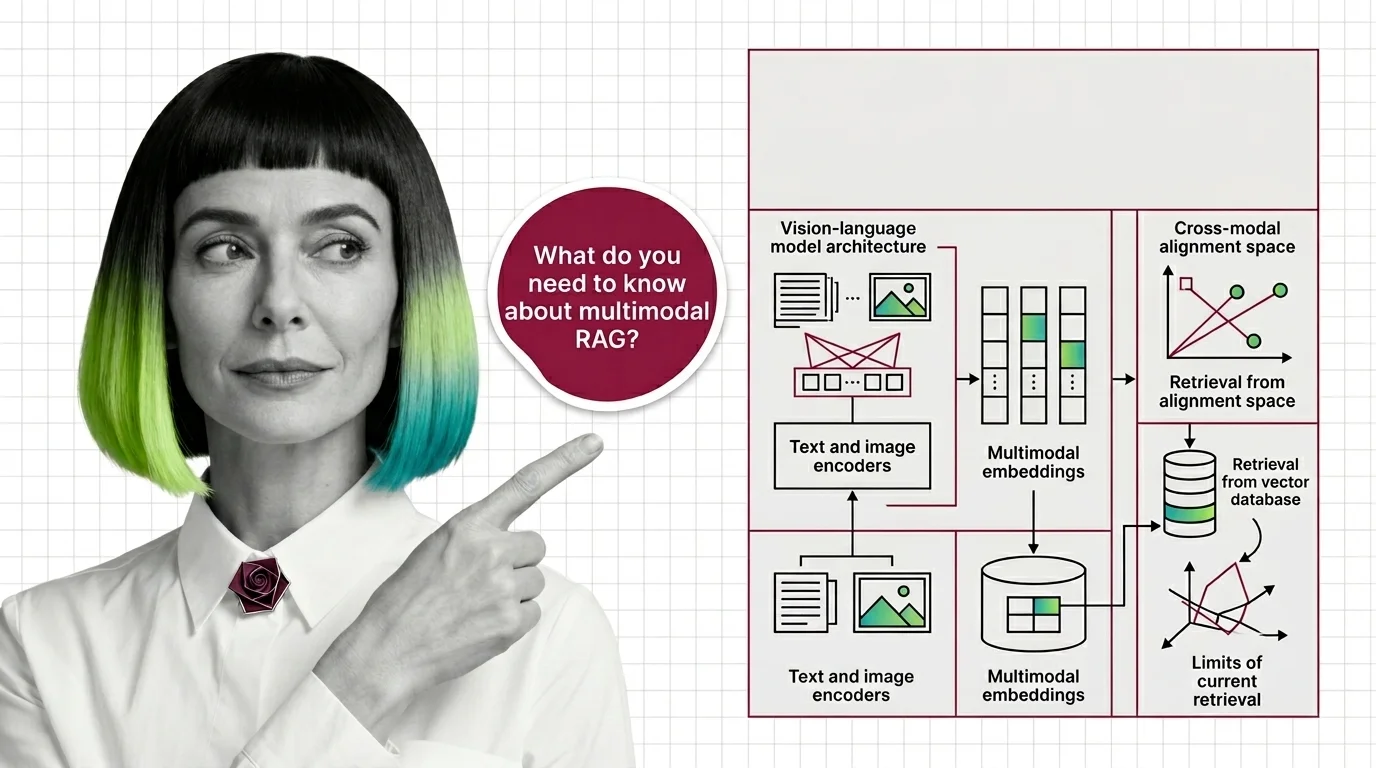
Multimodal RAG Prerequisites: Vision-Language Models, Cross-Modal Alignment
Before multimodal RAG works, you need vision-language models, shared embeddings, and a theory of cross-modal retrieval. …

Indexing Cost, Token Blowup, and the Hard Engineering Limits of GraphRAG at Scale
GraphRAG indexing costs scale with token recursion, not document size. A breakdown of the cost cliff, hallucinated …
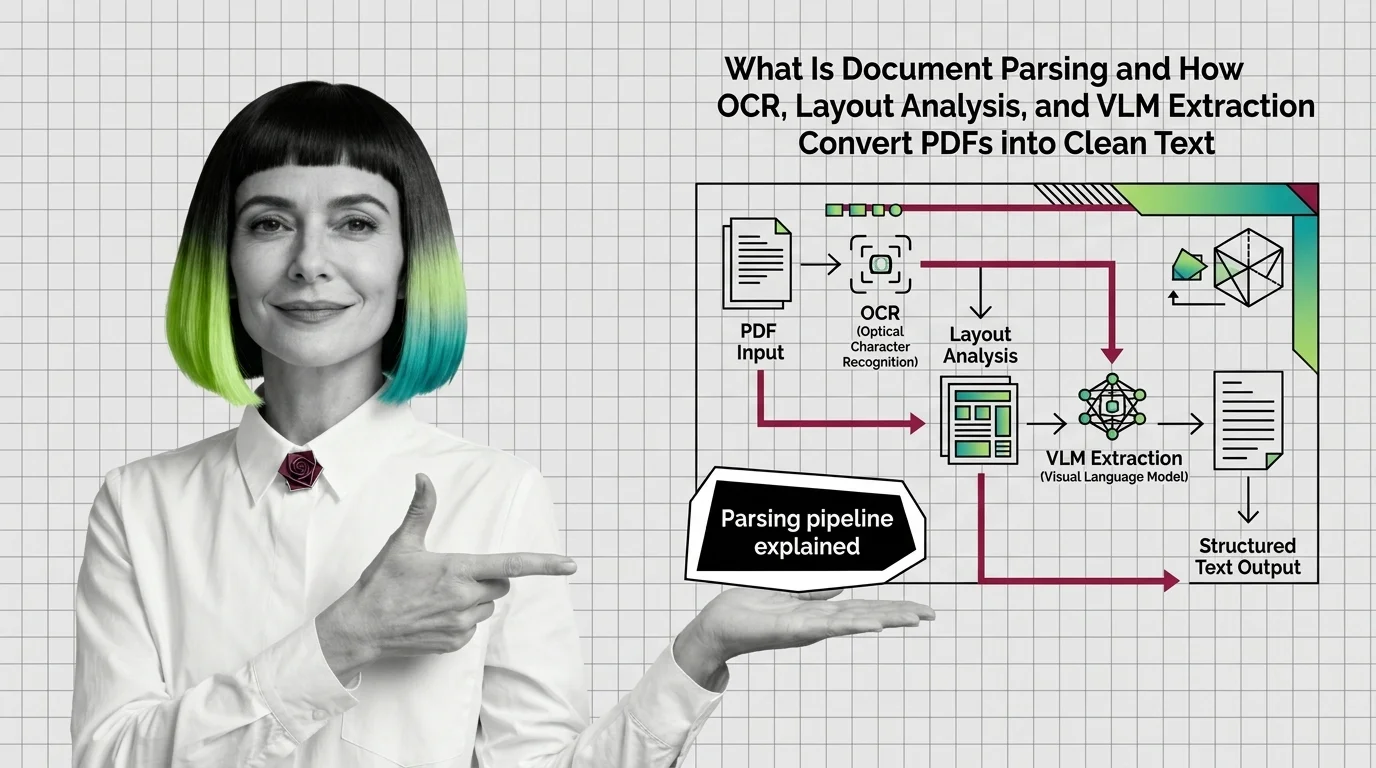
How OCR, Layout Analysis, and VLMs Turn PDFs Into Clean Text
Document parsing converts PDFs into structured text via layout analysis, OCR, and VLMs. Here is how each component works …
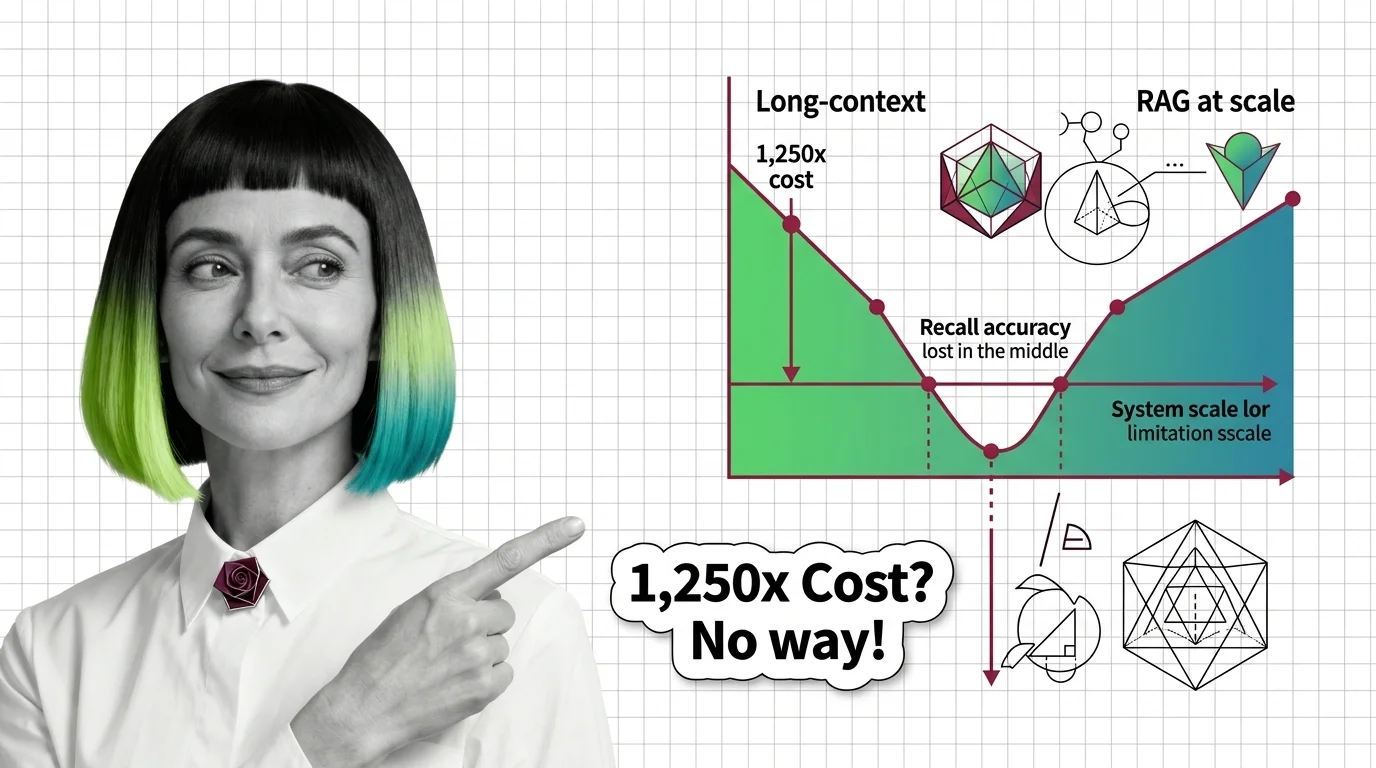
Lost in the Middle, 1,250x Cost: The Limits of Long-Context vs RAG
Long-context windows promise simplicity, but lost-in-the-middle, 1,250x cost gaps, and effective-context collapse at 32K …
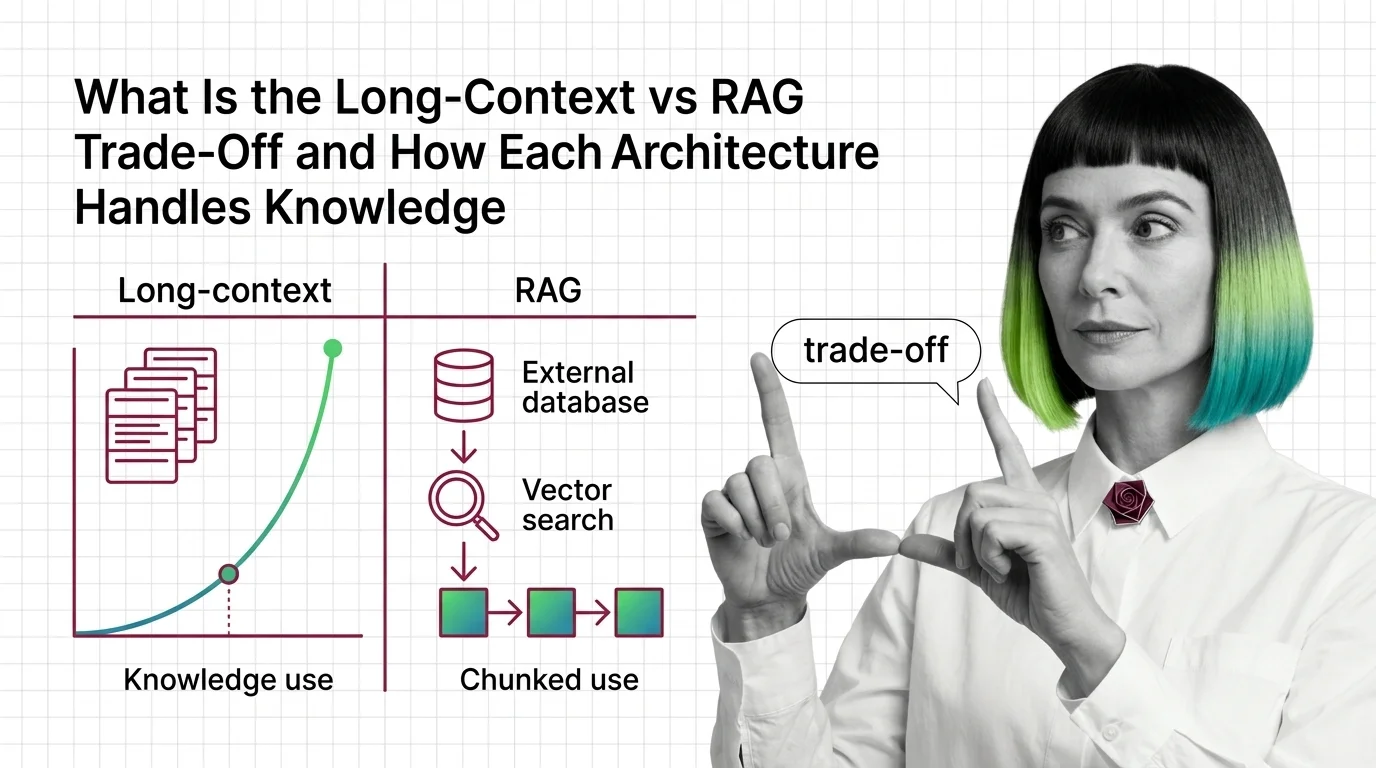
Long-Context vs RAG: How Each Handles Knowledge in 2026
Long-context and RAG sound interchangeable. They are not. The mechanics, failure modes, and cost curves diverge — see …
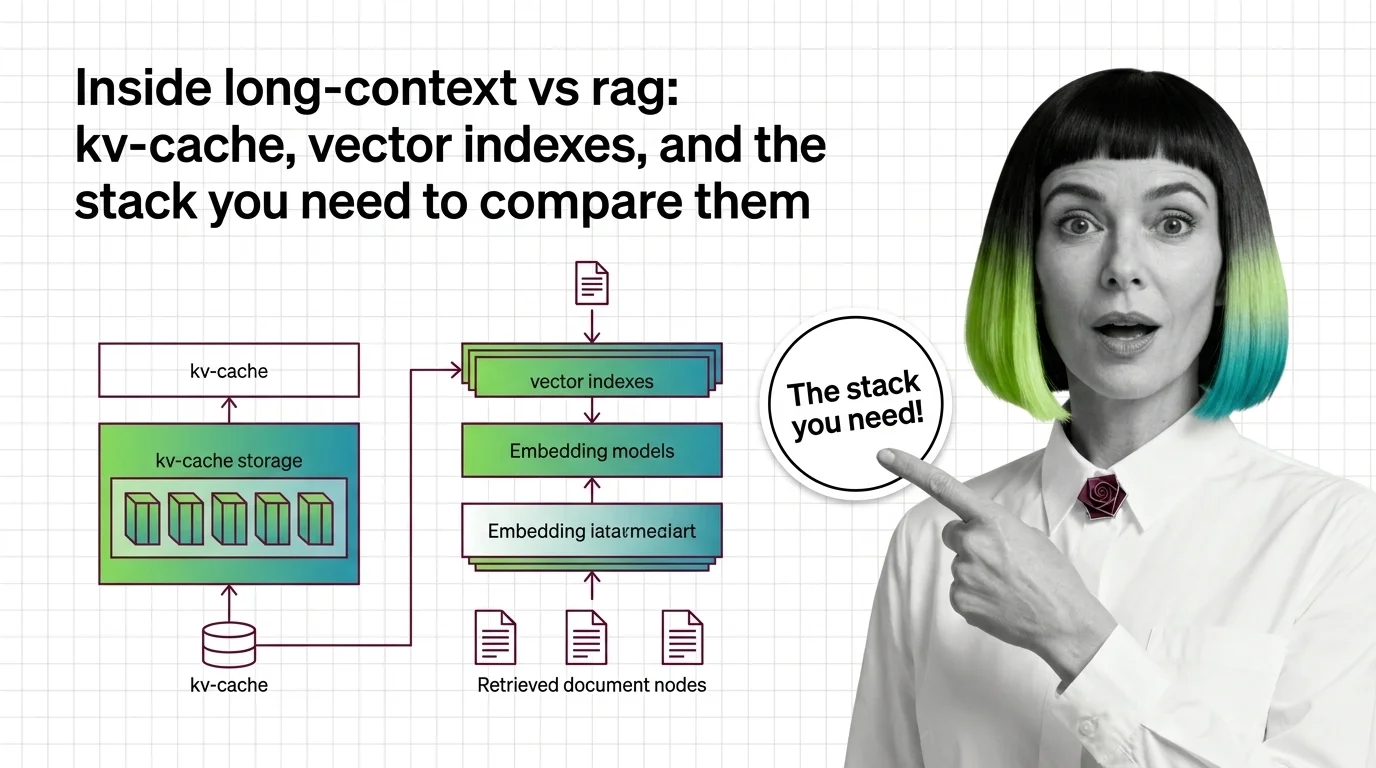
Inside Long-Context vs RAG: KV-Cache, Vector Indexes, and the Stack You Need to Compare Them
Long-context models and RAG pipelines compete for the same job with different parts. A component-by-component map of KV …
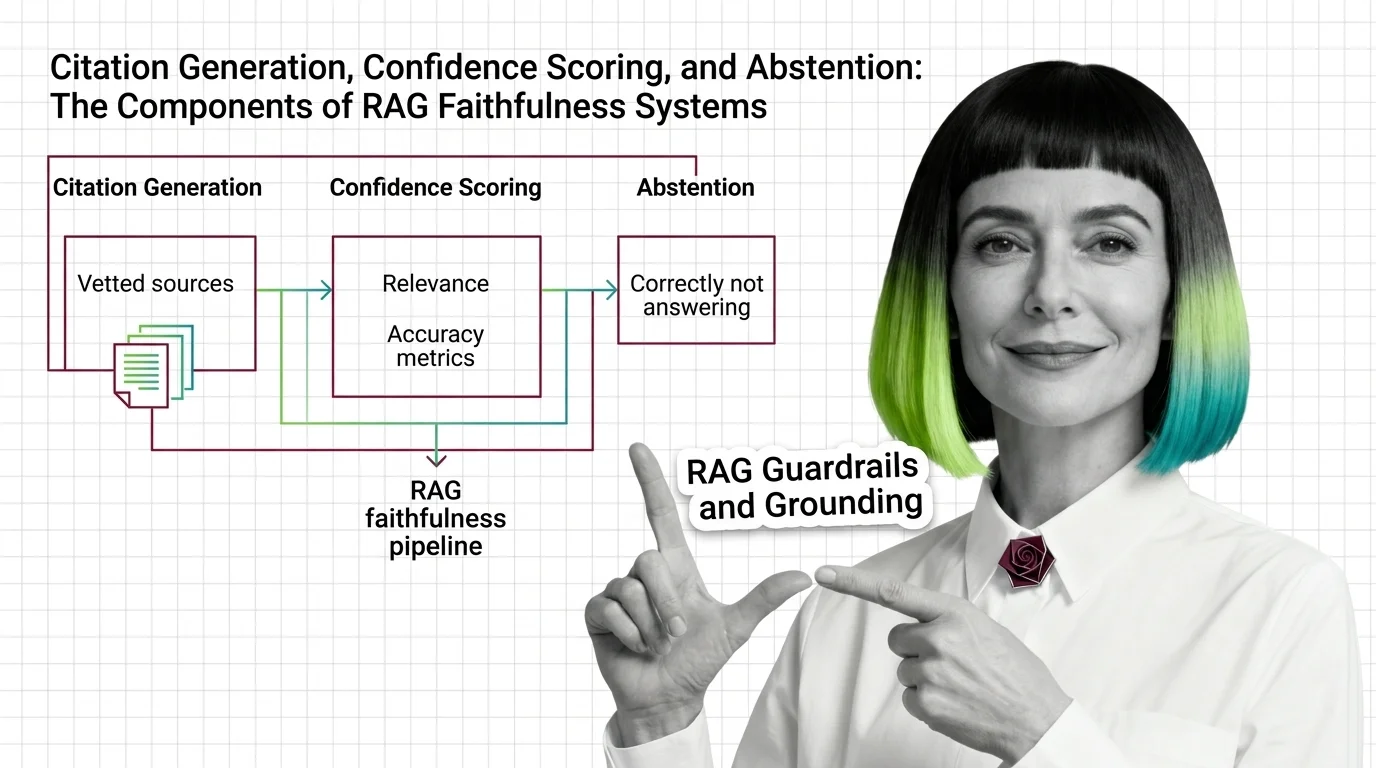
Citation, Confidence, and Abstention: The 3 Layers of RAG Faithfulness
RAG grounding splits into three layers: citation generation, confidence scoring, and abstention. See how each fails …
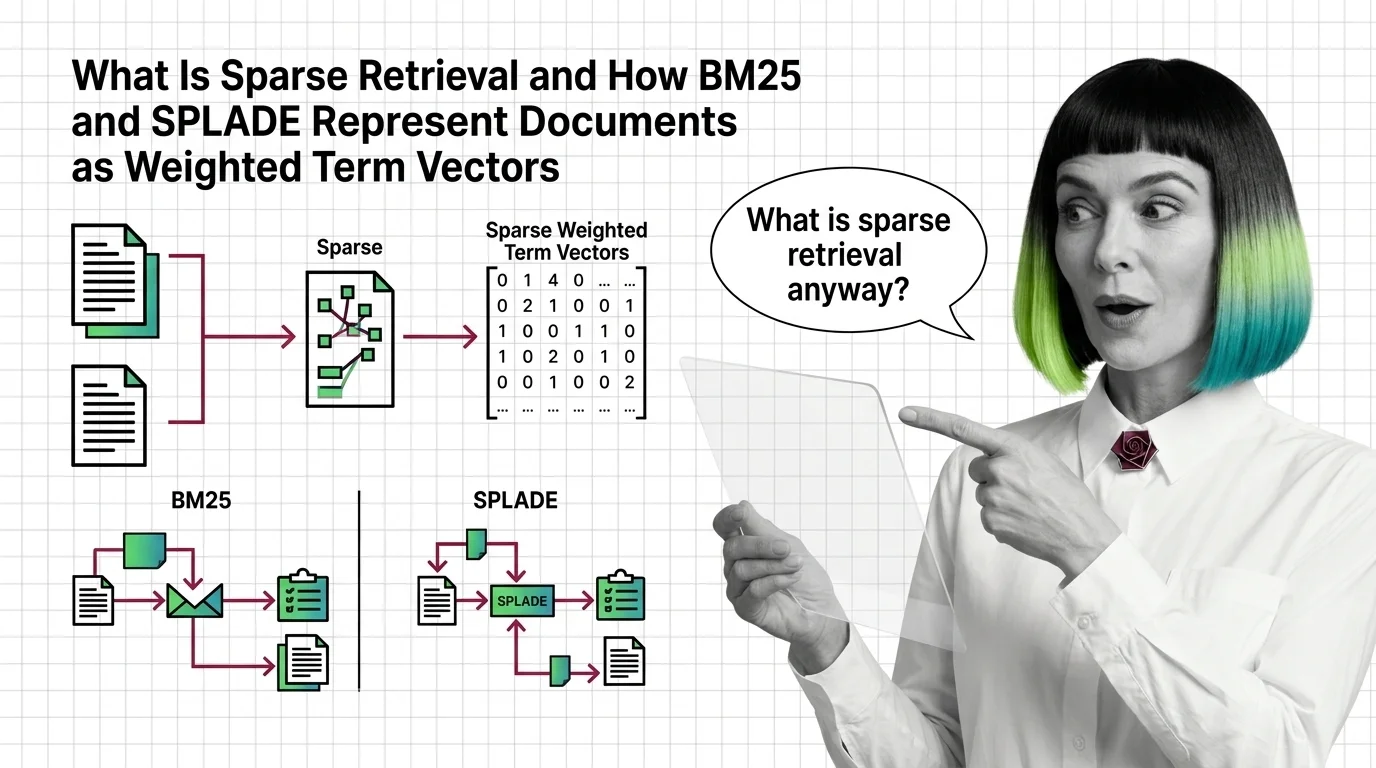
What Is Sparse Retrieval and How BM25 and SPLADE Represent Documents as Weighted Term Vectors
Sparse retrieval encodes documents as weighted term vectors. Here is how BM25 and SPLADE produce those weights and why …
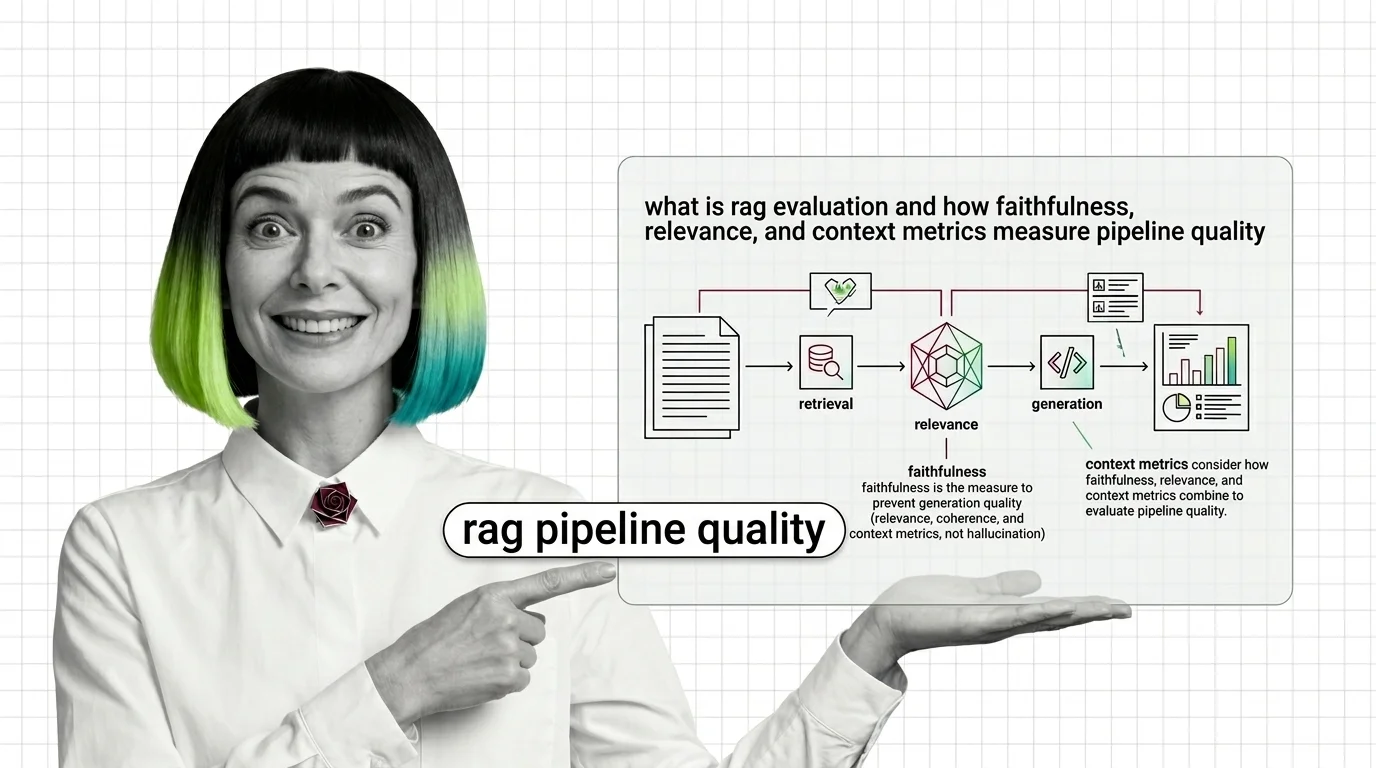
RAG Evaluation Explained: Faithfulness, Relevance, Context Metrics
RAG evaluation splits your pipeline into retriever and generator and scores each. Learn how Faithfulness, Relevance, and …
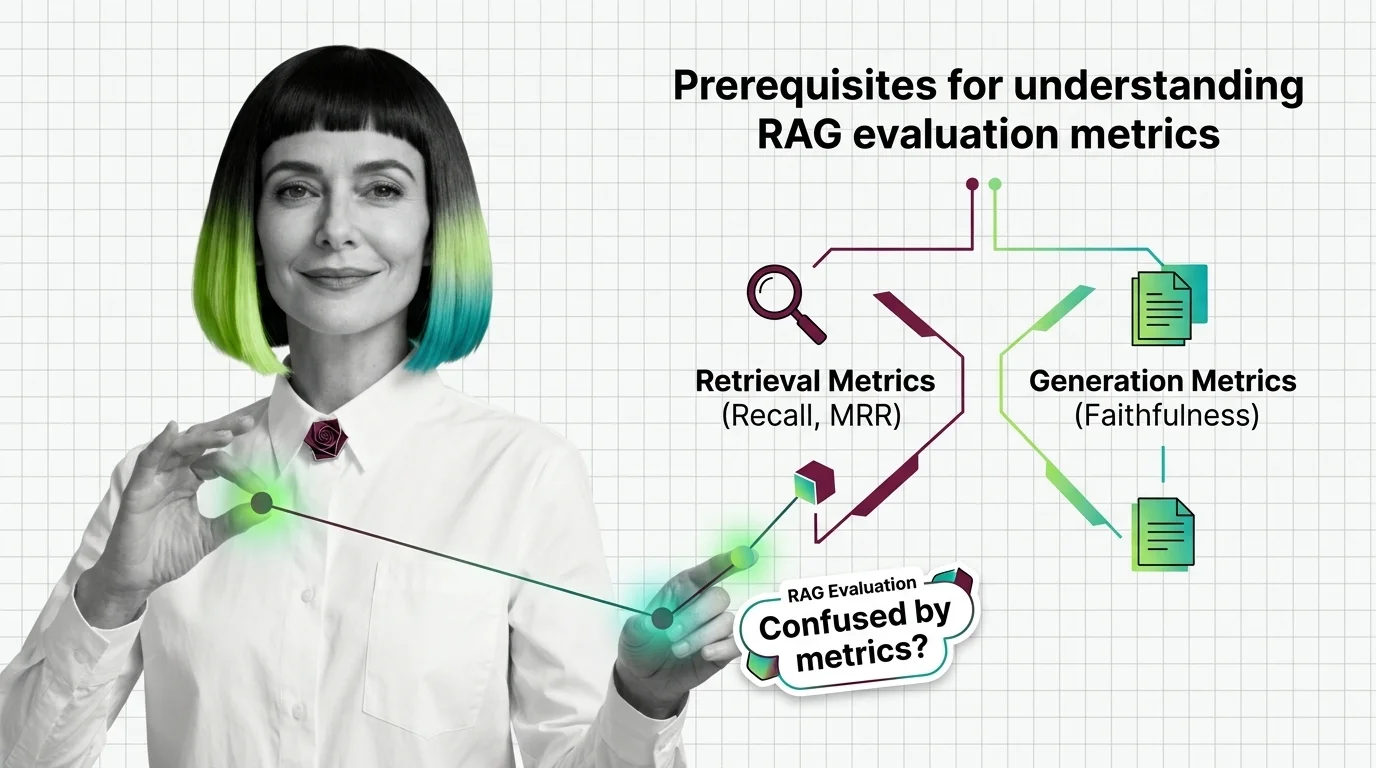
From Recall and MRR to Faithfulness: RAG Evaluation Prerequisites
RAG evaluation needs more than one accuracy score. Learn the IR and generation metrics — Recall, MRR, Faithfulness, …
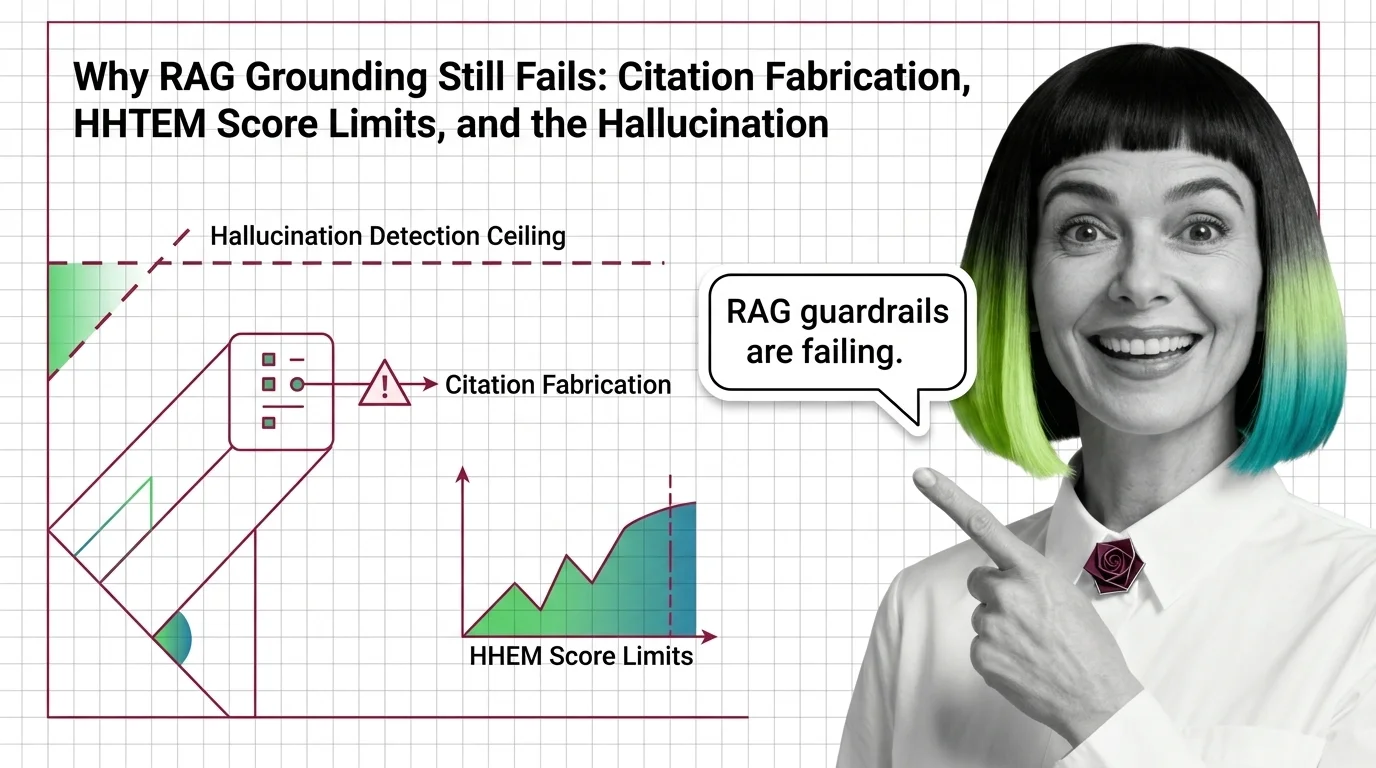
Why RAG Grounding Still Fails: The Hallucination Detection Ceiling
RAG hallucination detection has a certified ceiling. Why HHEM, Lynx, TruLens, and NeMo Guardrails miss the hardest …
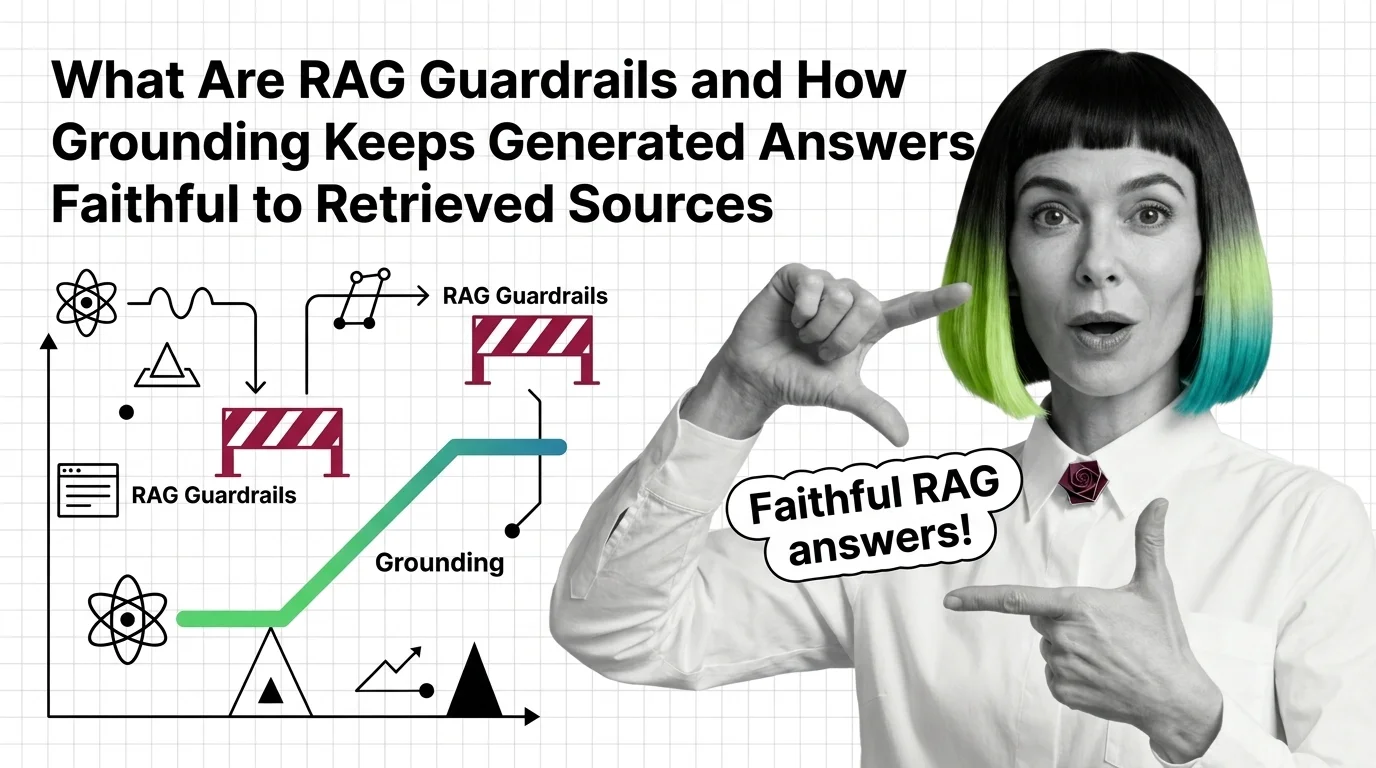
What Are RAG Guardrails and How Grounding Stops Hallucinations
RAG guardrails and grounding force generated answers to stay tied to retrieved sources. Learn how the mechanism works in …
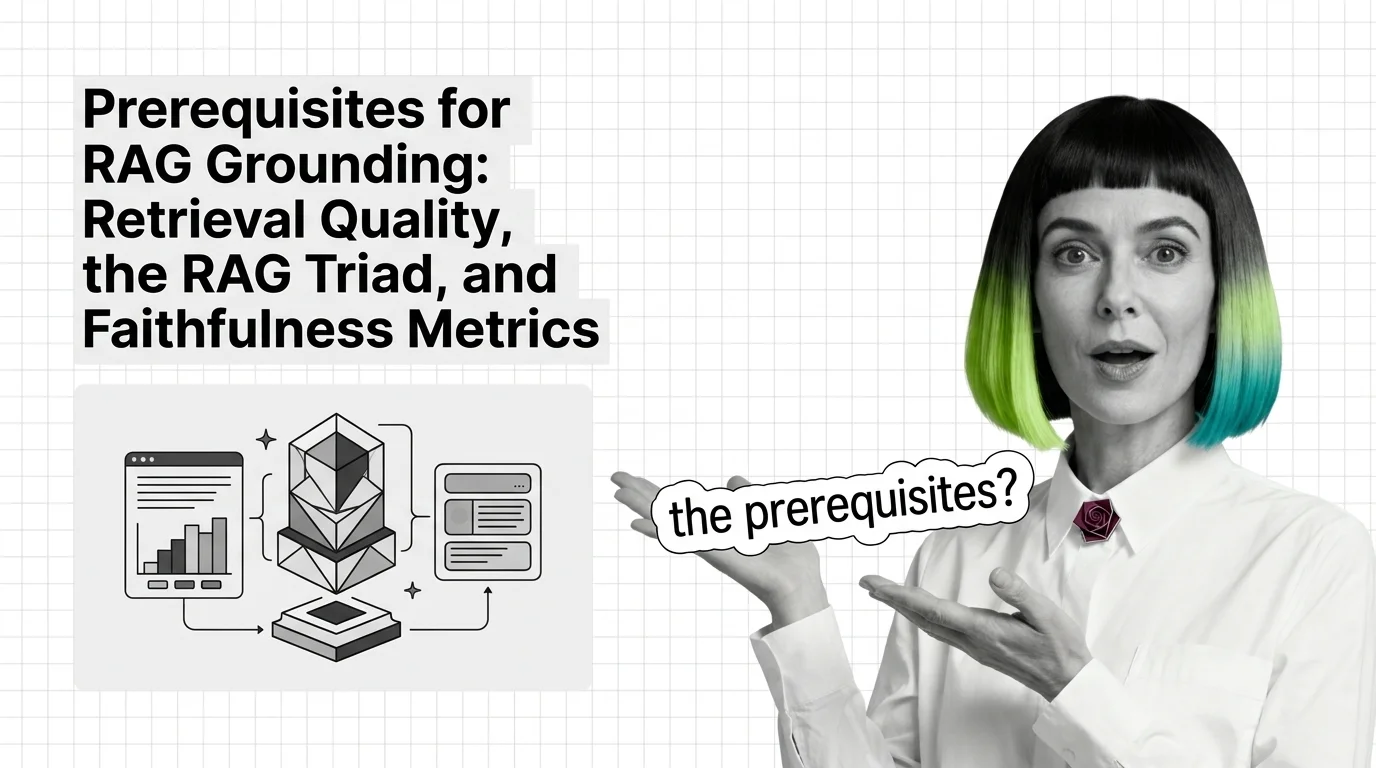
Prerequisites for RAG Grounding: Retrieval Quality, the RAG Triad, and Faithfulness Metrics
Before you bolt guardrails onto a RAG pipeline, learn the RAG Triad — context relevance, groundedness, answer relevance …
LLM-as-Judge Bias and the Technical Limits of RAG Evaluation
RAG evaluation frameworks like RAGAS rely on LLM judges with documented biases. Why faithfulness and answer relevancy …
From TF-IDF to Learned Sparse: Prerequisites and Hard Limits of BM25, SPLADE, and ELSER
Sparse retrieval starts with BM25 and ends with ELSER and SPLADE-v3. Learn the math, the prerequisites, and where each …
From RAG to Agents: Prerequisites and Hard Limits of Agentic RAG
Agentic RAG is a stack with new failure modes, not an upgrade. Learn the prerequisites and the four physics that limit …
What Is Agentic RAG and How LLM Agents Decide What to Retrieve
Agentic RAG turns retrieval into a decision: an LLM agent chooses whether to retrieve, which source to query, and …
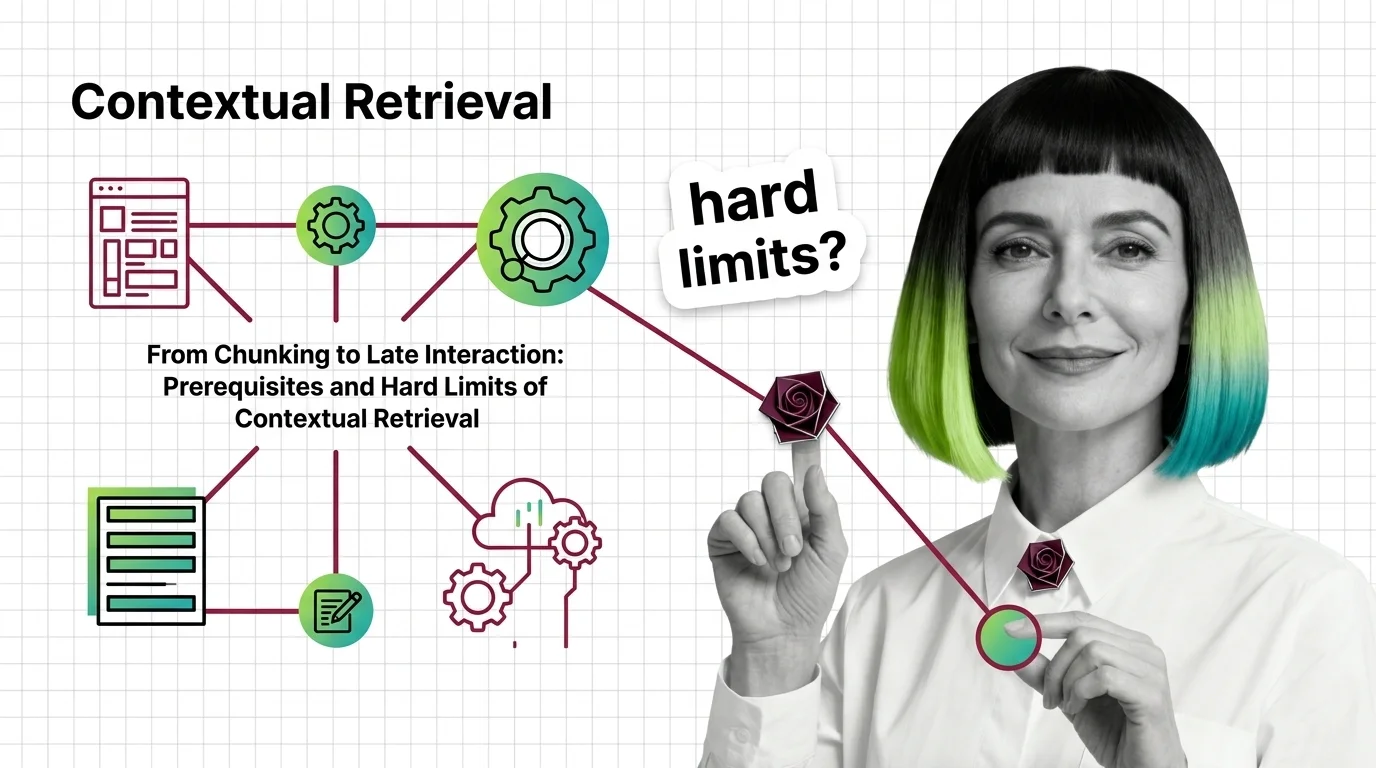
Contextual Retrieval: Prerequisites and Hard Limits at Scale
Contextual Retrieval cuts RAG failure rates, but at a cost. Learn the prerequisites — chunking, hybrid search, reranking …
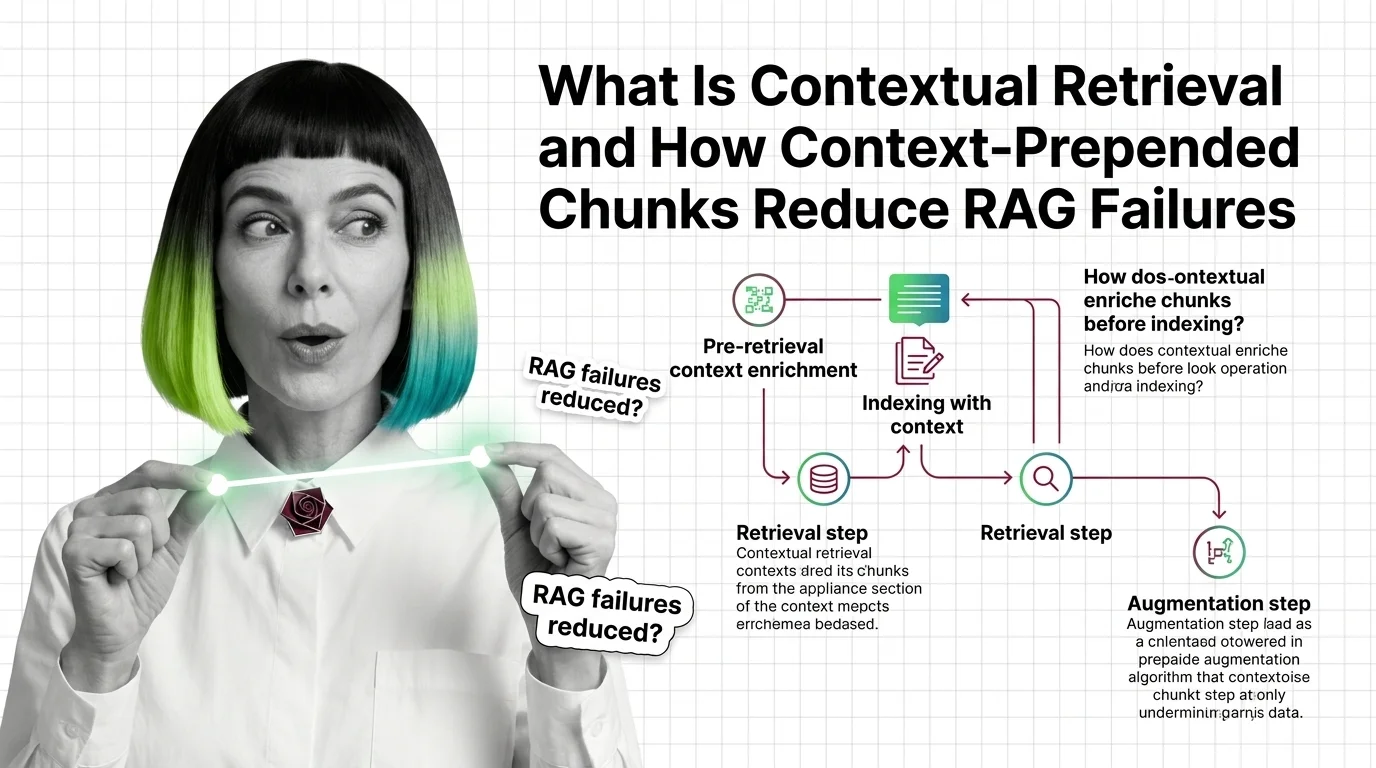
Contextual Retrieval: How Prepended Context Reduces RAG Failures
Contextual retrieval prepends 50-100 tokens of LLM-generated context to each chunk before indexing. Anthropic reports a …
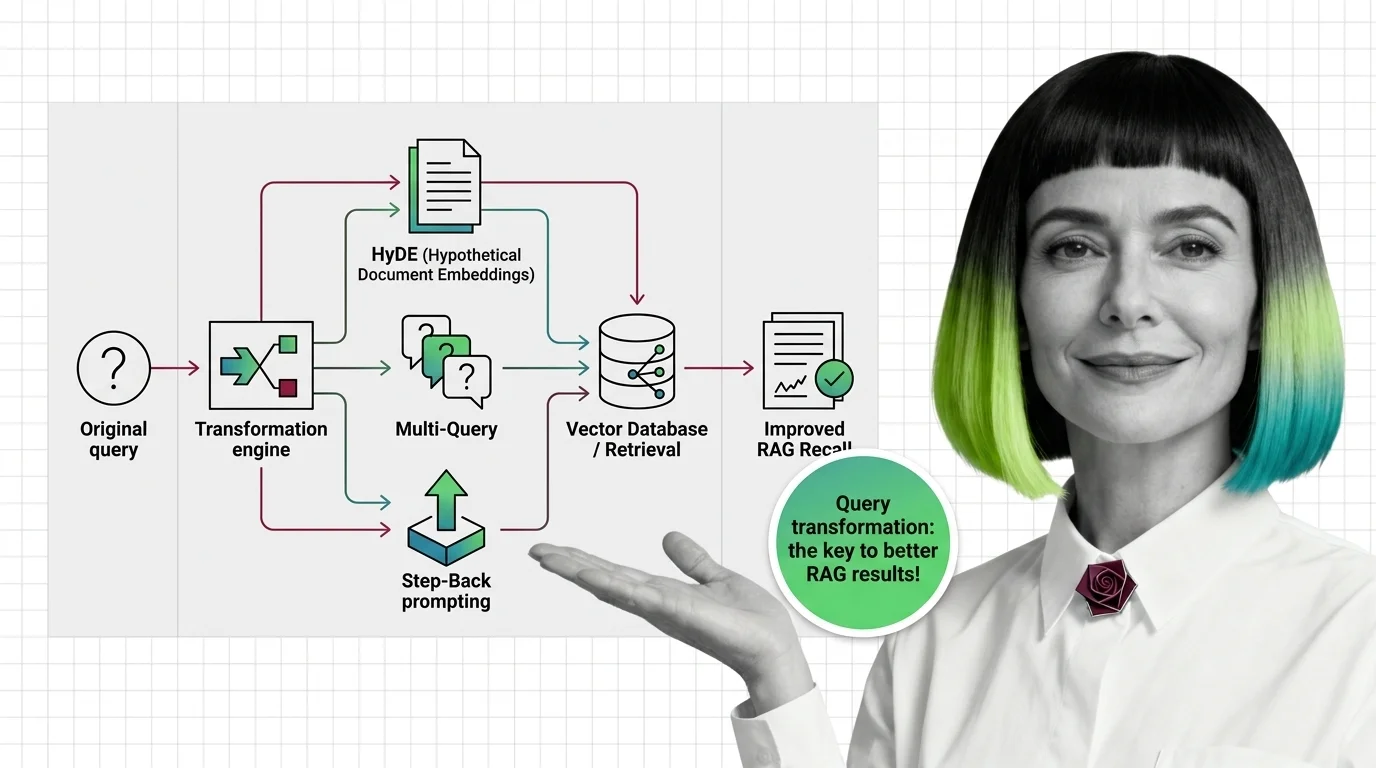
How HyDE, Multi-Query, and Step-Back Improve RAG Retrieval Recall
Query transformation rewrites user prompts before retrieval. Learn how HyDE, Multi-Query, and Step-Back Prompting close …
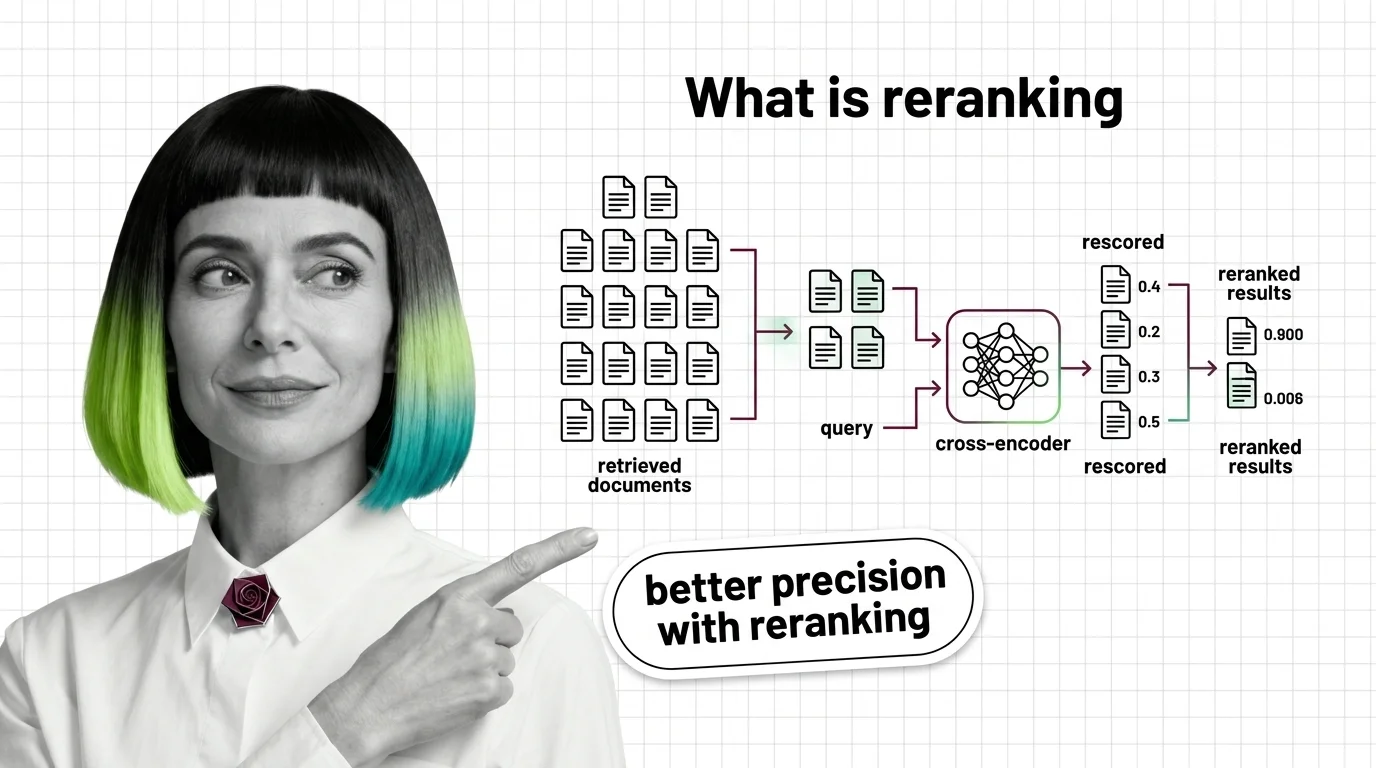
What Is Reranking and Why Cross-Encoders Rescore RAG Retrieval
Reranking splits recall and precision into two stages. See how cross-encoders rescore retrieved documents and why a …
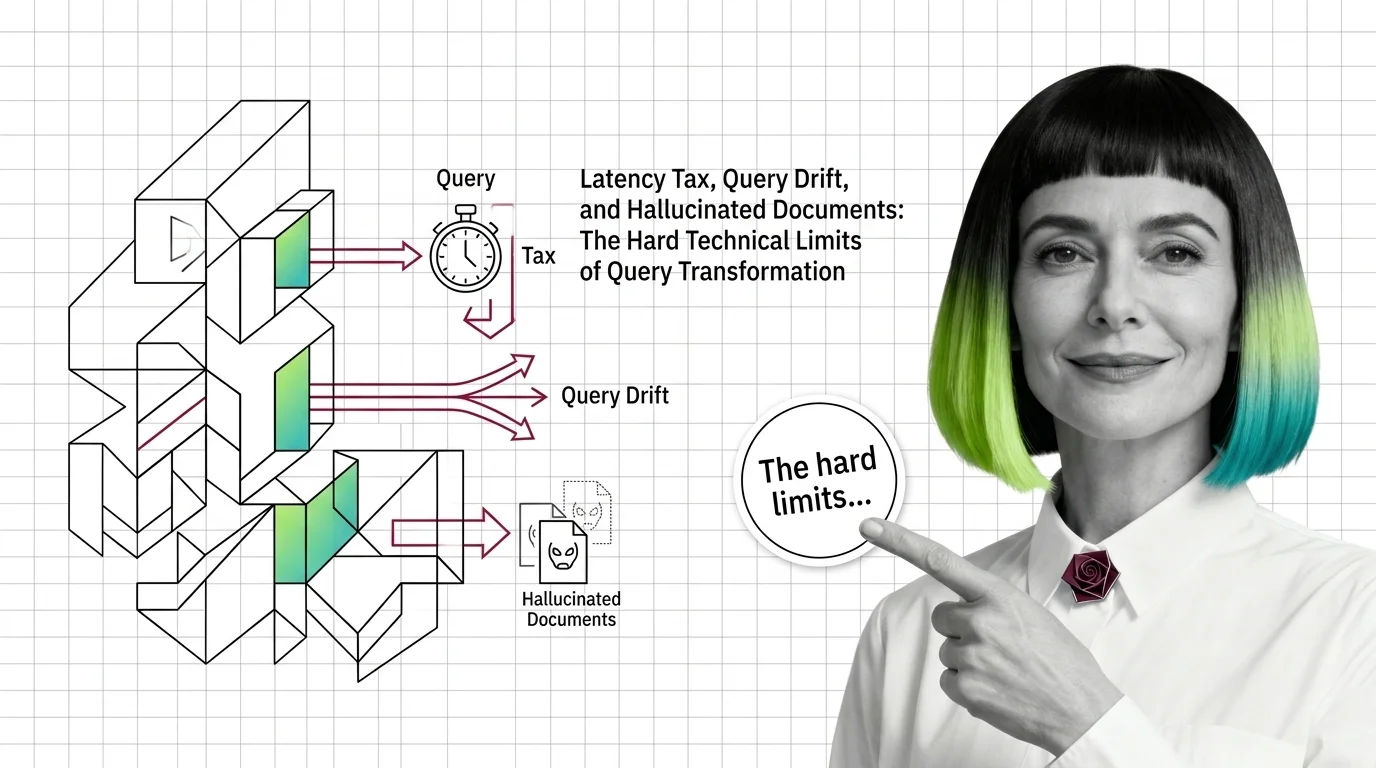
Query Transformation Limits: Latency Tax, Drift, Hallucinated Documents
Query transformation in RAG hits three hard limits: latency tax from extra LLM calls, query drift on simple inputs, and …
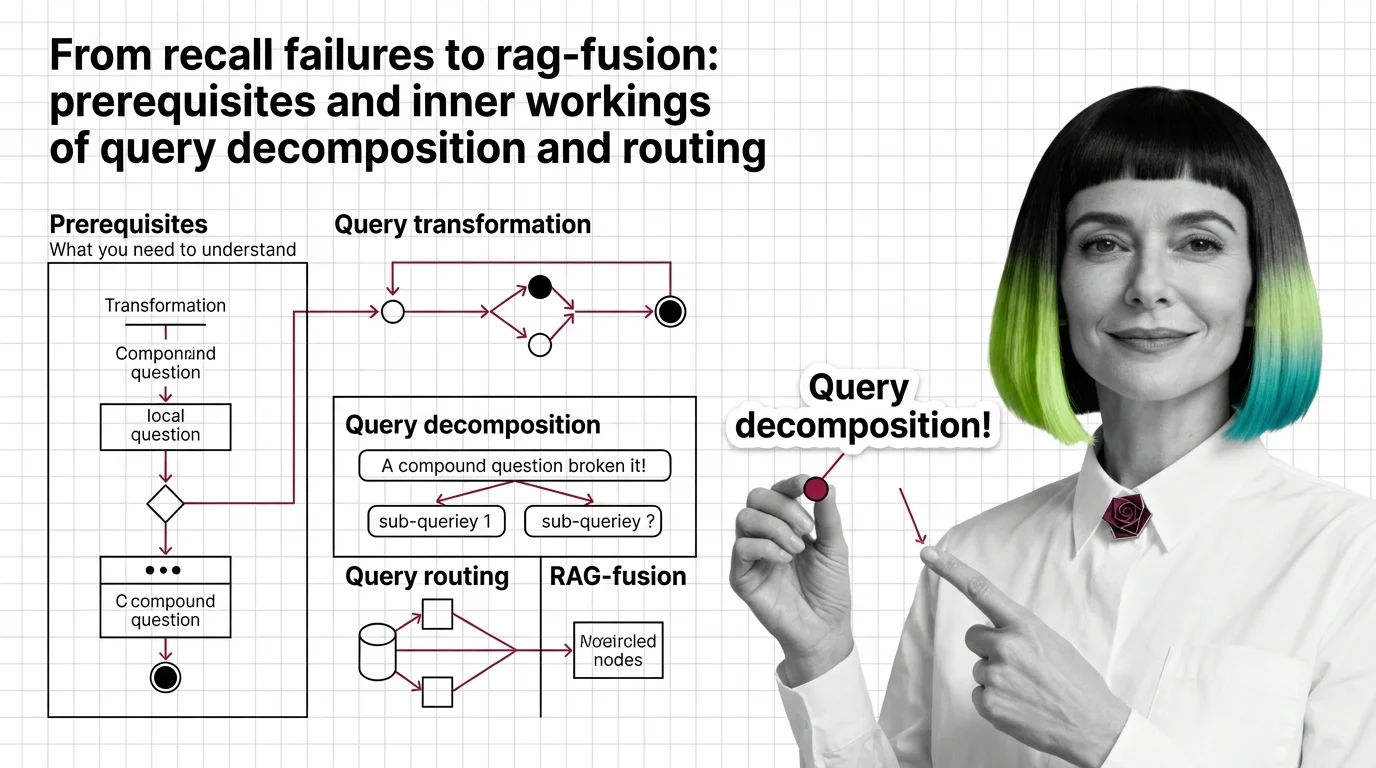
From Recall Failures to RAG-Fusion: Prerequisites and Inner Workings of Query Decomposition and Routing
Vector retrievers lose compound questions to a single point. Query decomposition, routing, and RAG-Fusion fix it by …
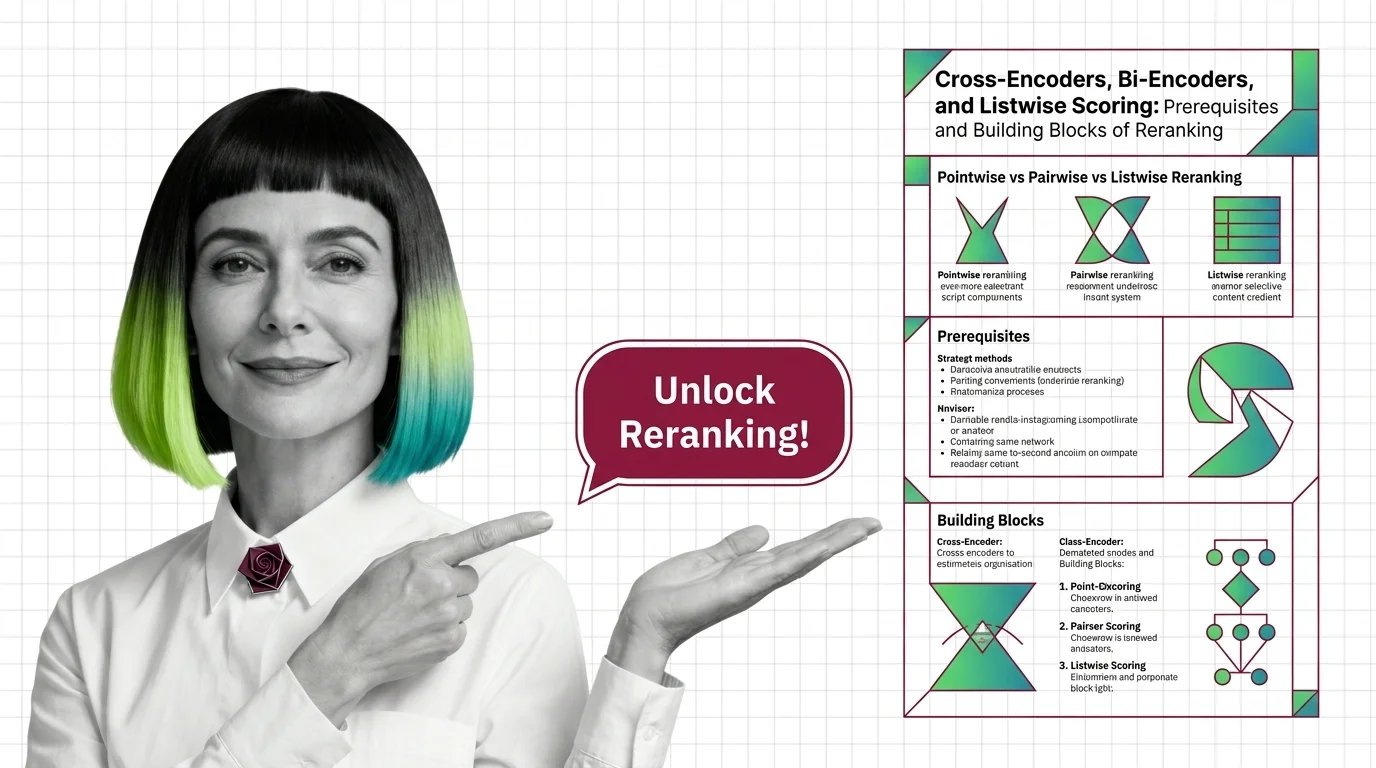
Cross-Encoders, Bi-Encoders, and Listwise Scoring in Reranking
A reranker reorders the top candidates from vector search using a heavier model. Cross-encoders, bi-encoders, and …
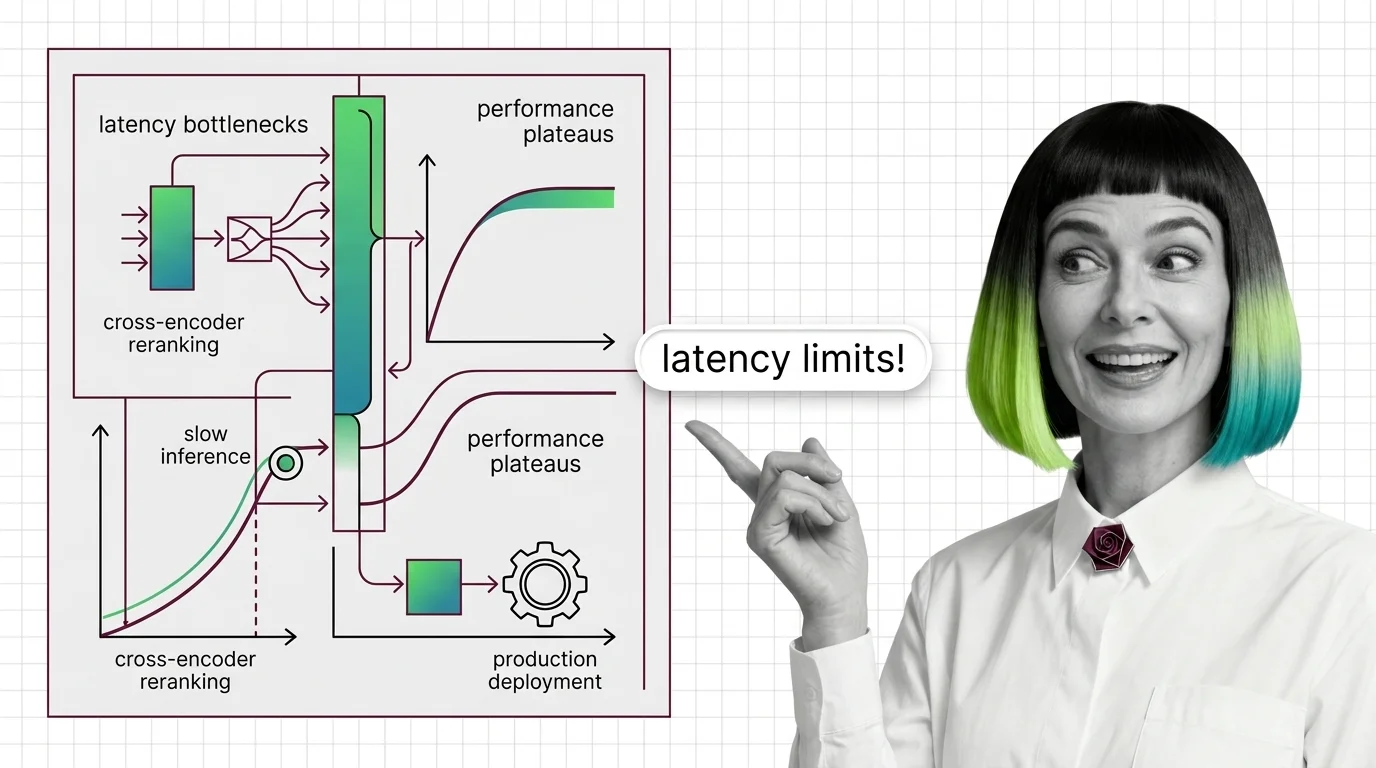
Cross-Encoder Reranker Limits: Latency Walls and Domain Drift
Cross-encoder rerankers hit two architectural walls: latency scales linearly with candidates and quadratically with …
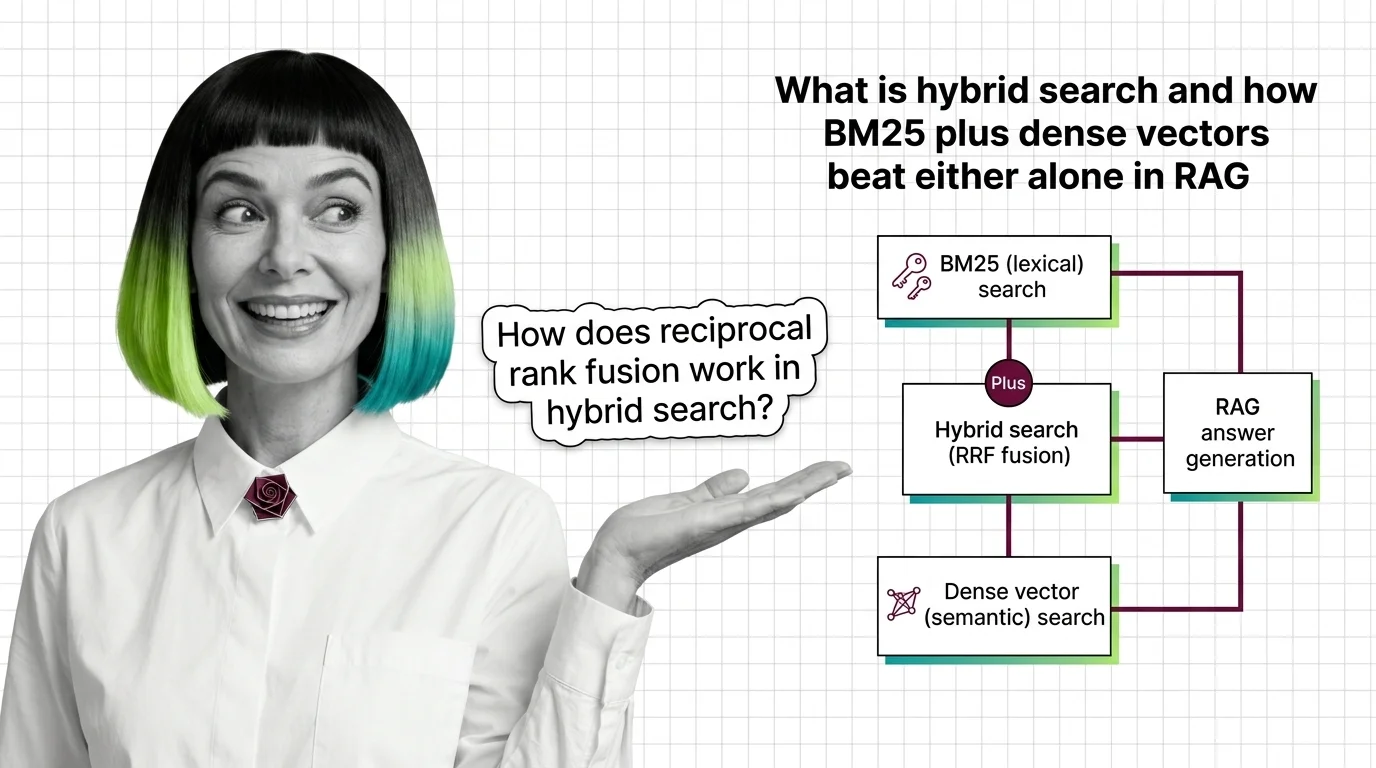
What Is Hybrid Search and How BM25 Plus Dense Vectors Beat Either Alone in RAG
Hybrid search fuses BM25 keyword retrieval with dense vector search using reciprocal rank fusion. Why two ranked lists …