Debugging a Transformer When You Can't Set a Breakpoint
The pager fires at 2 a.m. A summarization endpoint that shipped clean three weeks ago is returning a fluent, confident, completely wrong answer for one customer’s contract — and only sometimes. You do the first thing every incident has ever taught you to do: capture the exact input and run it again, so you can watch the failure happen under a debugger.
It succeeds. You run it a third time — different output, and this time it is correct. Nothing threw. No branch went the wrong way. There is no stack frame to open, because the wrong answer was not produced by a line of code. The bug is real. It will not hold still long enough to be caught.
A transformer incident is rarely a defect at a fixed input — it is a confidently wrong output shaped by sampling and learned routing, so debugging becomes reasoning about a distribution of behaviors rather than stepping through code. The reflex that fails first is the most trusted one: reproduce it, then read the execution path. Inside a forward pass there is no path to read. This is orientation for engineers who call models, not the ones who train them.
Why the Same Input Won’t Reproduce
Reproduce it first is the opening move of every bug hunt you have run, and it is the first casualty here. A hosted model is a Transformer Architecture, and it samples its output: at each step it draws the next token from a probability distribution, and unless every knob that shapes that distribution is pinned, two identical requests can walk two different paths to two different answers. The variance is not corruption. It is the design.
Your instinct to capture the failing input still transfers — and it matters more here, not less. What breaks is the next step: capture plus replay no longer equals reproduction. Every major model behind a chat or completion API is a Decoder Only Architecture that generates autoregressively, one token at a time, each token conditioned on the ones already emitted. Sampling draws each of those tokens from a distribution, so one different draw early cascades into a different completion. If token thirty diverges, tokens thirty-one onward already belong to another answer.
There is a partial rescue, and it comes straight from your release playbook. You pin dependencies with a lockfile so a build is reproducible; here you pin the model version, the sampling temperature, the seed, and every generation parameter, then log them next to the request. That turns a non-deterministic call into a mostly repeatable one — mostly, because providers reserve the right to change the model behind an unchanged version string, and floating-point non-determinism on parallel hardware can still shift a draw. Pinning narrows the distribution. It does not collapse it to a point.
In practice, this means your first on-call artifact is not a single failing trace but a captured request you can replay dozens of times, with the model version and parameters recorded beside it. A bug you can only trigger one time in five is still a bug — you measure it instead of reproducing it.
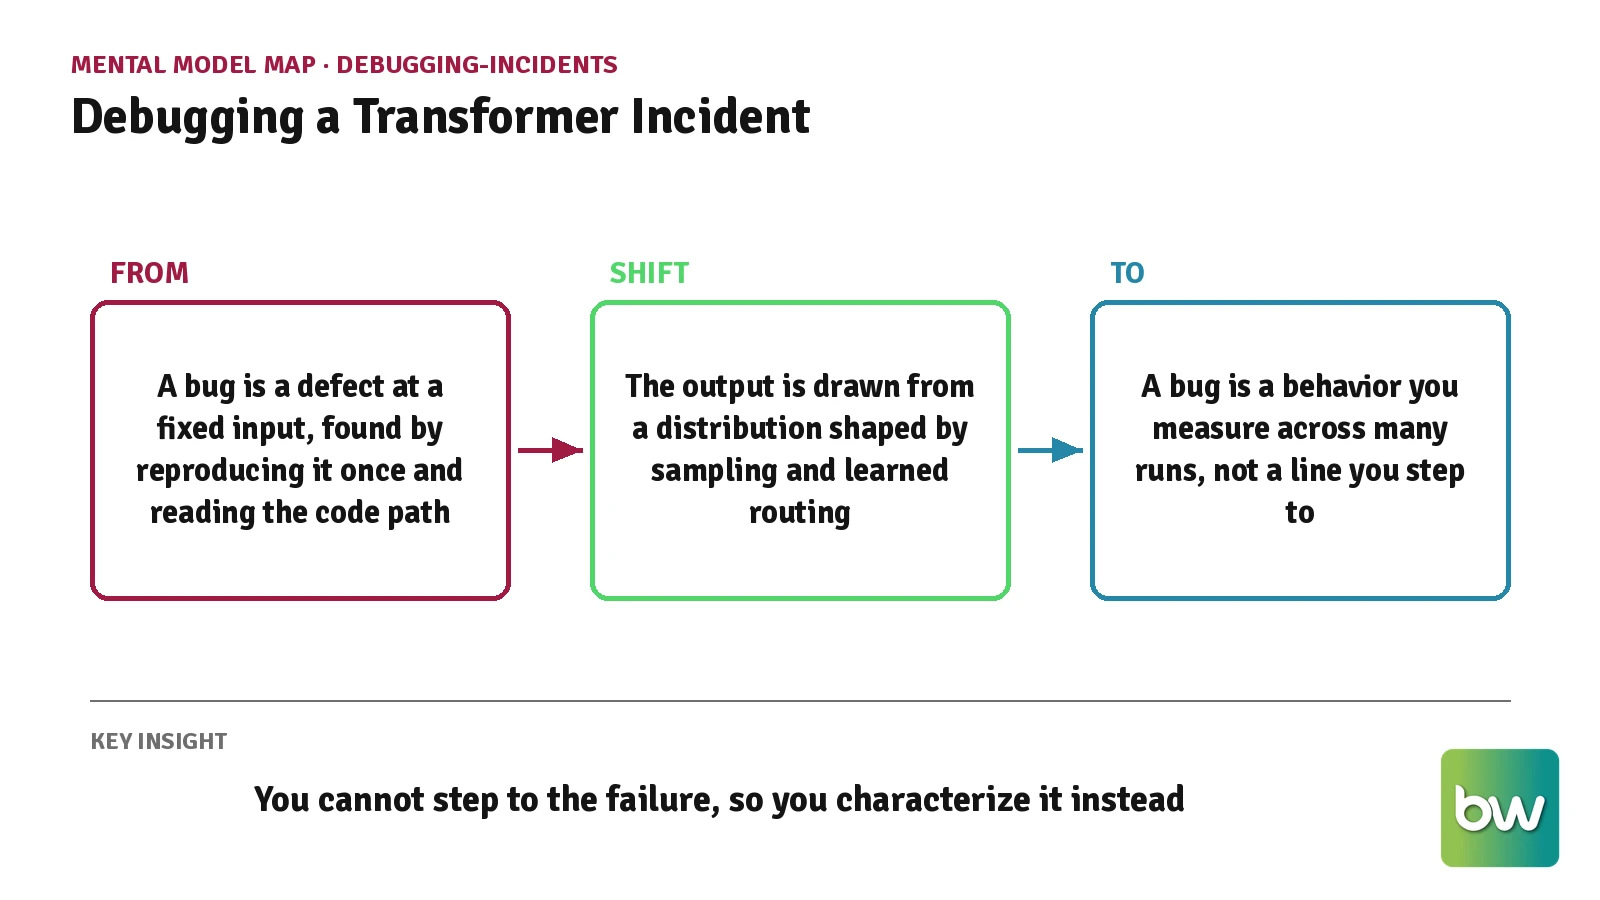
Mental Model Map: Debugging a Transformer Incident From: A bug is a defect at a fixed input, found by reproducing it once and reading the code path Shift: The output is drawn from a distribution shaped by sampling and learned routing To: A bug is a behavior you measure across many runs, not a line you step to Key insight: You cannot step to the failure, so you characterize it instead
The Forward Pass Has No Step Button
Set a breakpoint, step through, watch the state change line by line — the technique that resolves most bugs has nothing to attach to inside a model. A forward pass is one large, continuous numerical computation: billions of multiply-adds turning your tokens into an output, with no human-authored branches, no named variables to watch, no line that owns the decision. When the answer is wrong, there is no statement to blame, because no statement produced it. The decision lives in the trained weights, spread across more numbers than you could read in a lifetime.
Your observability instincts do transfer, and they are the strongest tool you keep. Structured request and response logging, tracing, correlation IDs stamped at the system edge — all of it works exactly as it does for any opaque third-party dependency, because that is what the model is. You cannot see inside the computation, but you can capture everything crossing its boundary: the exact prompt, the assembled context, the parameters, the raw completion, the latency, the token counts. Most model incidents are diagnosed from that boundary, not from within.
The expectation of an inspectable execution path no longer holds, but the expectation that you own the input does. In practice, this means you invest where you actually have leverage: capture more at the boundary, not less. The prompt template that assembled the context, the retrieved documents, the tool outputs spliced in — those are the parts you author, and they are where most wrong answers are actually born. The model is opaque. The input you handed it does not have to be.
Which Experts Ran Is Not Logged
Modern frontier models route each token through a fraction of their parameters, and which fraction is a decision you never see. A Mixture Of Experts model holds many parallel expert sub-networks and a small learned router that, for every token, picks a handful to run and skips the rest. The mechanics of that sparse gating decide which specialists see your token, and two requests that look identical to you can activate different experts — because the routing depends on the exact input and on how tokens were batched together at inference time.
In your own code, a conditional branch is inspectable by construction: you can log which arm ran, set a breakpoint on it, force it in a test. The router’s choice is none of those things. It is not exposed by the API, you cannot pin it, and you cannot condition a breakpoint on “stop when expert seven fires.” The instinct to inspect which branch ran breaks the moment the branch lives inside the model. When the router load-balances poorly or collapses onto a few overused experts, quality degrades in ways that look random from outside — because the variable that moved is one you were never handed.
Hybrid models widen the blind spot. Many long-context systems now interleave attention layers with a State Space Model, which carries a compressed hidden state forward through the sequence instead of comparing every token to every other. That state is another execution path with no index into it: you cannot inspect what it retained or dropped, and the serving-stack complexity these hybrids add is exactly the kind of hidden state your debugger was built to expose and here cannot. Not a branch you can log. A route you infer from behavior.
In practice, this means routing-driven variation is a first-class hypothesis during triage, not an afterthought — and the only place you can act on it is your own controls: pinning a model version, reducing how aggressively sensitive requests share a batch, and treating “same input, different quality” as expected behavior to be measured rather than a contradiction to be resolved.
The Attention Map Is Not a Stack Trace
The most seductive tool in model debugging is an attention visualization, and read as a causal explanation it is a trap. An attention map shows how much weight each token placed on every other token, and it is tempting to treat the brightest cells as the model “deciding” — the equivalent of a stack trace pointing at the guilty frame. That reading is a misconception, and it sends incident triage toward the wrong root cause.
The Attention Mechanism is a weighted-averaging operation, not human-like focus. High weight marks what was blended into a representation, not what caused the final token, and the two come apart in ways that mislead. Some of the heaviest weight in a long sequence lands on structurally empty tokens — the first token, punctuation, delimiters — where the model parks spare capacity on positions it treats as no-ops. These attention sinks look, on a heatmap, exactly like intense focus. They explain nothing about the wrong answer. For the geometry of how relevance is actually computed, the mechanism is worth reading before you trust any visualization of it.
In practice, this means attention visualizations belong in the hypothesis-forming stage, never in the verdict. Treat a bright cell as a question to test with a controlled input, not as evidence. What determined the output was the full trained geometry — the map shows you a shadow of it, and shadows are quick to misread.
How the Debugging Model Changes
When you cannot step to a failure, you characterize it — and that single change reorganizes the whole debugging loop. Instead of tracing one execution to one root cause, you run the input many times, hold every controllable variable fixed, and read the distribution of outputs: failure rate, drift from a known-good baseline, and what the bad runs share. The unit of investigation stops being the single run and becomes the sample.
| Classical debugging move | What it becomes on a model incident |
|---|---|
| Reproduce the failure once | Replay many times, measure how often and how far it fails |
| Step through to the faulty line | Read the boundary: prompt, context, parameters, raw output |
| Inspect which branch executed | Treat routing and sampling as unlogged variables to control |
| Assert exact expected output | Assert on distributions, ranges, and invariants |
| Fix the line, close the ticket | Pin versions, add a regression sample, watch for drift |
Shift Diagram: Investigating a Wrong Output Classic: Reproduce once → Step through code → Find the faulty line → Patch and verify exact output AI: Capture the input → Replay many times → Measure the output distribution → Pin config and add a regression sample
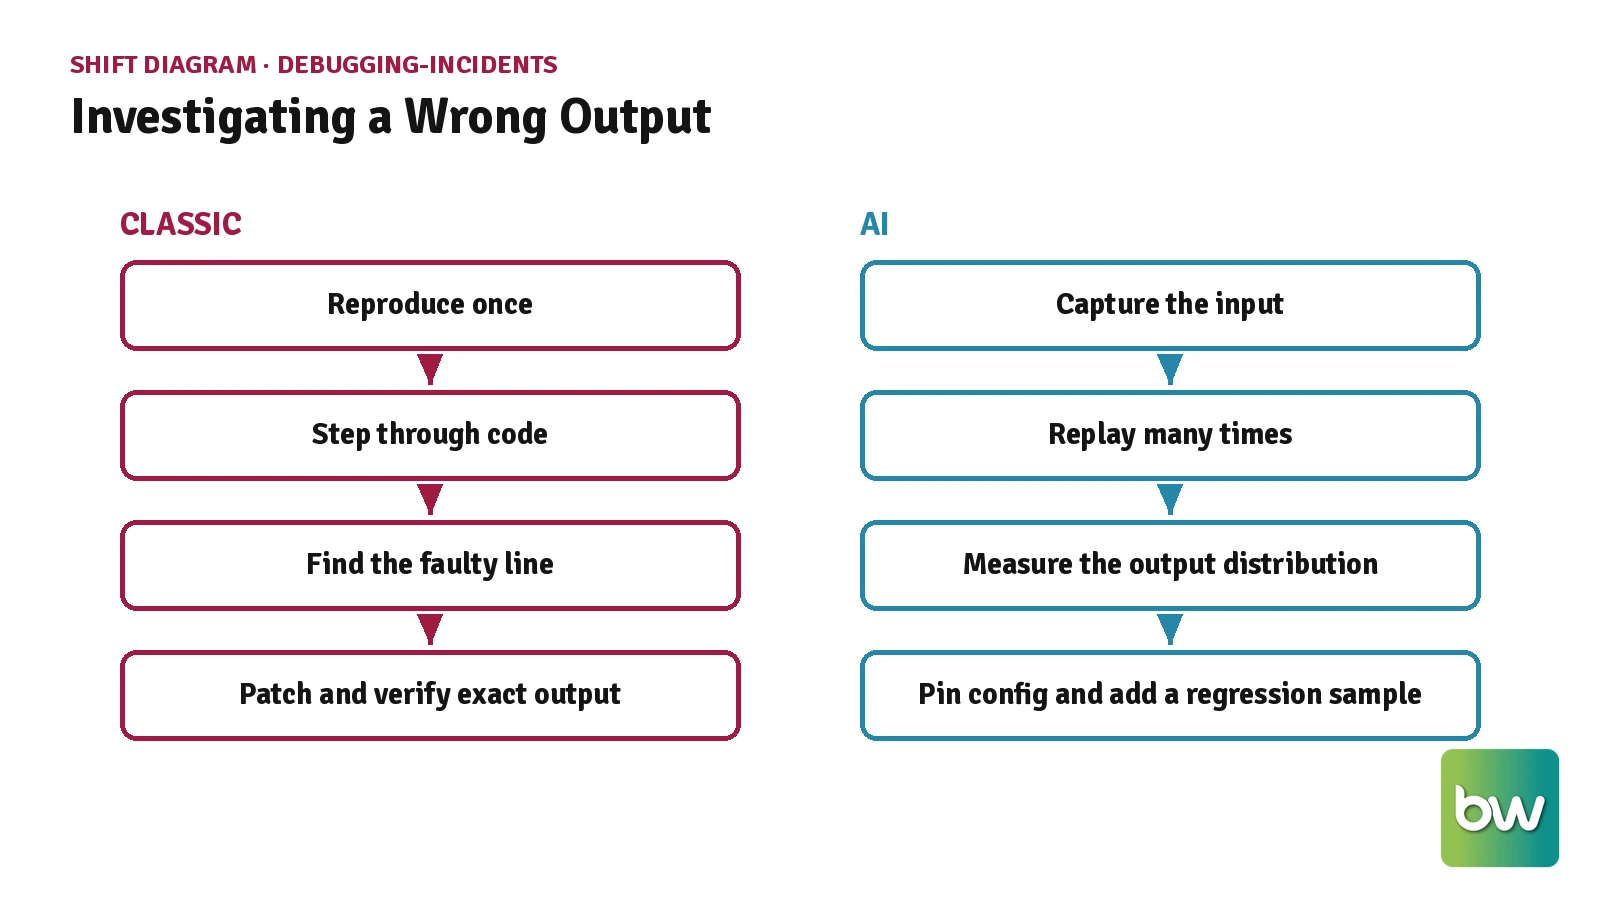
This is where the shift lands hardest on your test suite. Exact-match assertions on model output flag harmless resampling as failure and let real regressions pass as noise. Assertions on properties — length bounds, required fields, refusal behavior, distance from a reference answer — survive the non-determinism and still catch the drift that matters. In practice, the assertion that says “equals this string” becomes the assertion that says “stays inside this shape.”
Before You Page the Vendor
Before an incident becomes a vendor ticket, most of the signal you need sits on your side of the boundary. These are questions to ask about your own stack — not the vendor’s — while the incident is still warm.
| Runtime question | Why it matters |
|---|---|
| Did I capture the exact input, model version, and generation parameters? | Without them the incident is not reproducible even in the loose, statistical sense |
| What is the failure rate across many replays, not only the one I saw? | A frequent failure and a rare one are different incidents with different urgency |
| Did a default or the model change server-side without a deploy on my end? | Silent model swaps produce quality shifts your changelog will never mention |
| Are my assertions checking exact strings or output properties? | Exact-match tests break on healthy non-determinism and hide real regressions |
| Is the wrong output correlated with long context or unusual input? | It points at attention dilution or routing, not at a fixed defect at one input |
A model incident is not a defect waiting at a fixed input — it is a behavior you characterize across many runs, shaped by sampling and routing you cannot step into. Keep the on-call instincts that still bite: capture everything at the boundary, pin what you can, and assert on distributions. For the full prerequisite map and the questions this article leaves unanswered, see the topic hub.
AI-assisted content, human-reviewed. Images AI-generated. Editorial Standards · Our Editors