Green Dashboard, Wrong Answers: Operating LLMs in Production
The LLM feature shipped in March. It has been green ever since. p99 latency sits inside budget, the error rate is a flat line, uptime has not dipped, and the one graph that moves at all is cost-per-request, creeping up a little each week. Then a support lead forwards you a thread: three customers, same week, got answers that were fluent, confident, and wrong. No exception fired. No request failed. Nothing deployed. You open the dashboard you trust and it tells you, in green, that everything is fine.
The dashboard is not lying. It is measuring a different thing than the one that just broke.
Running an LLM in production means owning a service whose correctness no runtime metric measures directly — you operate on proxies and hunt degradation the graphs can’t see. The assumption that breaks is the one built into every ops muscle you have: a healthy infrastructure signal means a healthy service. For a deterministic API it did. For a model, health and correctness are separate axes, and only one is on your dashboard.
Why a Green Dashboard Misses Wrong Answers
Every metric on that dashboard measures the transport, not the content. Latency tells you the tokens arrived quickly. Error rate tells you the call returned a 200. Uptime tells you the endpoint answered. None of them can tell you the answer was true. LLM Observability inherits this blind spot honestly: the tooling records what happened — the prompt, the completion, the latency at each hop, the token cost — but it cannot judge whether what happened was correct. A model can produce fluent, syntactically perfect output that is factually wrong, and no monitoring layer sitting between the model and the user will catch it. That is not a gap in your vendor’s product. It is a property of the thing you are watching.
Your instincts are not useless here. Far from it.
The mental model of distributed tracing transfers almost unchanged: one model call, one retrieval, one tool invocation, each modeled as a span with a start, an end, and structured attributes. If you have ever read a trace to find which downstream service ate the latency, you already know how to read a prompt chain. What Is LLM Observability walks the span model in full — it is the closest thing to familiar ground in this whole stack.
The assumption underneath the trace breaks here. In a deterministic service, the output is the proof: if the response is wrong, something threw, and the trace shows you where. In a model chain, the output is the least informative diagnostic point. A wrong answer and a right answer travel the same green path — same spans, same latencies, same 200. The failure is in the content, and the content is exactly what your infrastructure metrics are built to ignore.
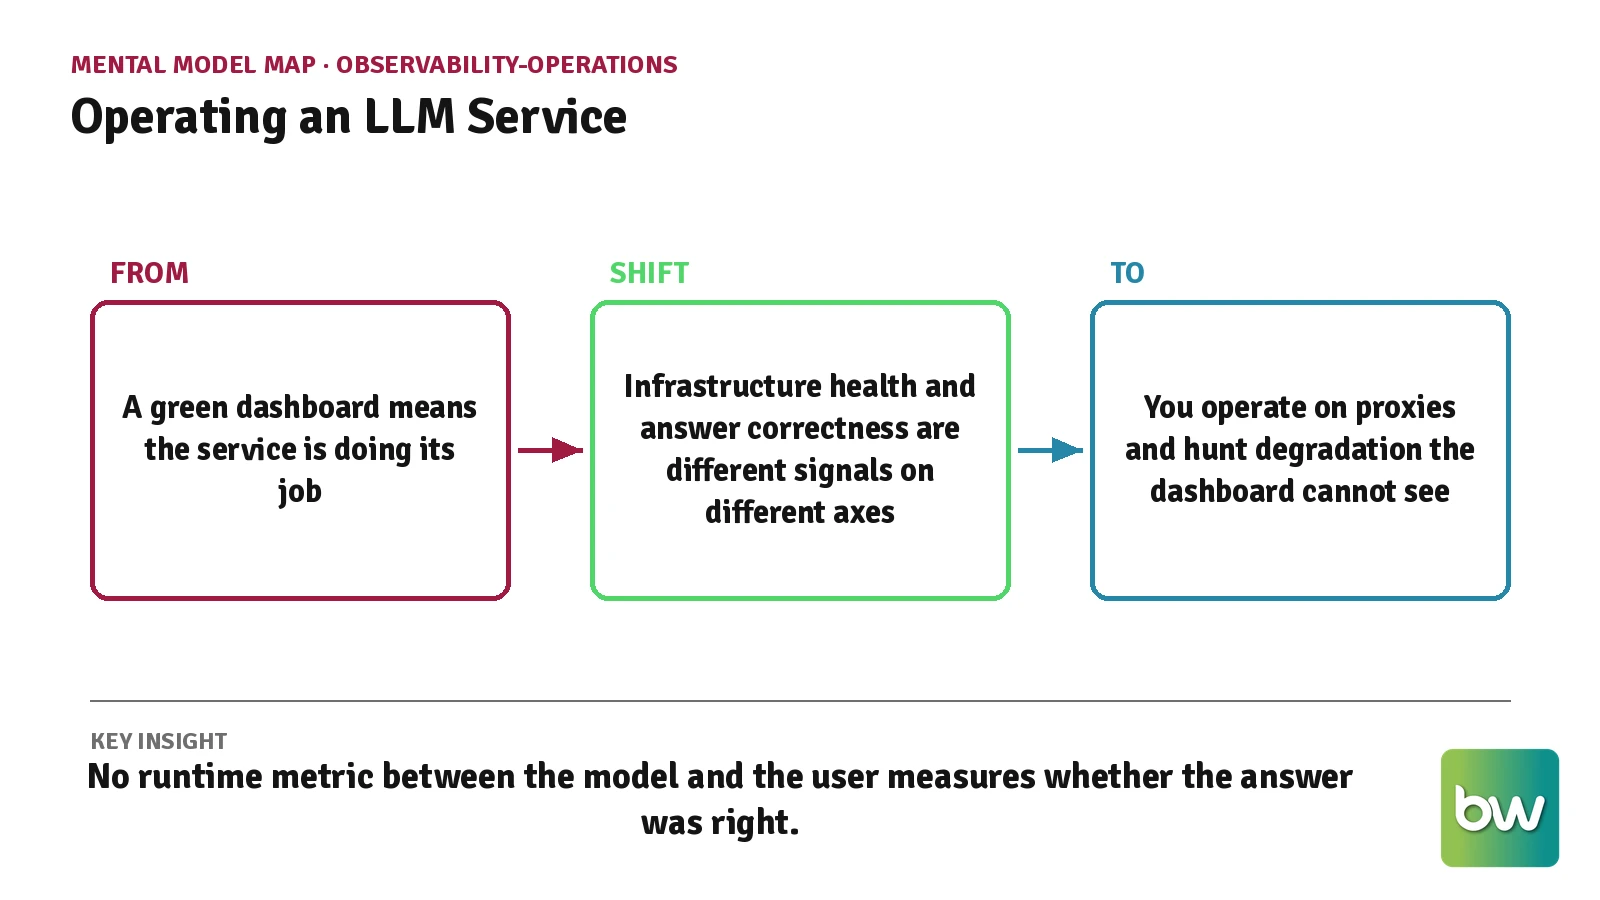
Mental Model Map: Operating an LLM Service From: A green dashboard means the service is doing its job Shift: Infrastructure health and answer correctness are different signals on different axes To: You operate on proxies and hunt degradation the dashboard cannot see Key insight: No runtime metric between the model and the user measures whether the answer was right.
In practice, this means the first thing you build after the endpoint works is not a nicer dashboard. It is a way to sample outputs and score them for correctness — because nothing already on the wall does that job.
Your Tracing Transfers, Your Alerting Breaks
The trace transfers. The alert does not. This split catches experienced operators, because tracing and alerting feel like one discipline and here they come apart.
Structured logging carries over almost intact. LLM Logging And Auditing wants the same things your incident forensics always wanted: a request ID, a timestamp, who called what, what came back, and enough lineage to reconstruct the sequence after the fact. Auto-instrumentation exists and works — Datadog’s LLM monitoring, for one, wraps OpenAI, Anthropic, and Bedrock calls without touching the call site, the same way an APM agent always has. If you can stand up structured logs and read a trace, you are most of the way to instrumented.
The alerting layer is where the instinct breaks. A latency spike in a microservice means one thing: a resource or logic problem, page someone. A latency spike on a model has two structurally different causes — the model hit a genuinely hard query and ran a longer reasoning chain, or the infrastructure degraded and evicted a cache. Same spike, opposite responses, and a fixed threshold cannot tell them apart. The result is a systematically higher false-positive rate on the exact alerts you trust most.
There is a second trap, and it is a versioning one. The shared vocabulary for all this — the OpenTelemetry GenAI semantic conventions — is still marked experimental. Span kinds and attribute names can change before it stabilizes, and a new attribute added to the spec can silently read as null on a dashboard built against last quarter’s version. You are instrumenting against a moving target. Before You Monitor LLMs is the honest prerequisites list — read it before you assume the tooling will surface regressions on its own.
And when you do watch latency, watch the right shape of it. Under concurrency a model endpoint does not degrade gracefully; it hits a cliff governed by GPU memory, not CPU threads, which is why REST-style LLM Load Testing produces numbers that look fine right up until they don’t. The signal that predicts trouble is the ratio between your worst-case and median time-to-first-token: when P99 stays within about 2× of P50, the system is absorbing load; when it climbs past roughly 5×, the cache is the binding constraint and no timeout tuning will save you.
| Ops instinct from deterministic services | Transfers | Where it breaks on a model |
|---|---|---|
| Read a trace to localize a failure | Yes | The failing step still returns 200; the failure is in the content |
| Structured logs for post-incident forensics | Yes | Reconstructing “what happened” needs the prompt and retrieval, not just the request |
| Fixed-threshold latency alerts | No | A spike can mean a hard query or degraded infra — same number, opposite action |
| Error rate as the health signal | No | The most damaging failures never move the error rate |
The trace is your ground truth for where a request went. It is not, on its own, evidence that the request went well.
The Router Swaps Your Model and Says Nothing
Here is the failure with no exception, no failed request, and no deploy event to point at: the model behind your endpoint changed, and nothing in your pipeline announced it.
You built resilience the way you always have.
LLM Fallback And Retry Patterns look like the retry and circuit-breaker stacks you have shipped for a decade — retry the transient error, trip the breaker on a bad dependency, fall back to an alternative. The primitives transfer cleanly. What is new is what “the alternative” is. A classic fallback swaps to a replica that does the same thing. A model fallback swaps to a different model — often a cheaper, weaker one — that does the same job at a lower quality you cannot see in any status code.
This is why an LLM feature needs its own observability even when you never run a model yourself. Route everything through a hosted LLM Gateway and you have handed a policy engine the right to pick a model per request. Model Routing sends cheap queries to a cheap tier and escalates the hard ones — a real cost win, and Model Routing shows why the savings are a function of your request mix, not the router you chose. But the same layer will quietly downgrade you: a fallback chain fires on a provider blip, a Context Window Management overflow reroutes to a model with a different window, and the served model is no longer the one you tested. The gateway usually records which model actually answered — in a response header or field — but only if you are reading it.
Even without a router, the ground moves. A model tested against last month may have changed under you with no version bump, because the provider updated it. Deprecation windows exist, but the measured gap between announcement and retirement can run far shorter than the stated policy. Silent Model Switching is the accountability version of this problem — worth reading before an incident, not after.
There is a grim irony in which signal does move. When a router shifts your traffic to a cheaper tier, the graph that responds is LLM Cost Management — cost-per-request ticks down, and if you are only watching the bill, you read a downgrade as a win. Cost is the one proxy that reliably moves, which makes it the most dangerous one to trust alone.
One more thing you now own: that gateway is a single process holding every provider credential you have, and 2026 was not kind to that layer — gateway vulnerabilities were exploited within hours of disclosure. A chokepoint that routes all your traffic is also a chokepoint that can leak all your keys.
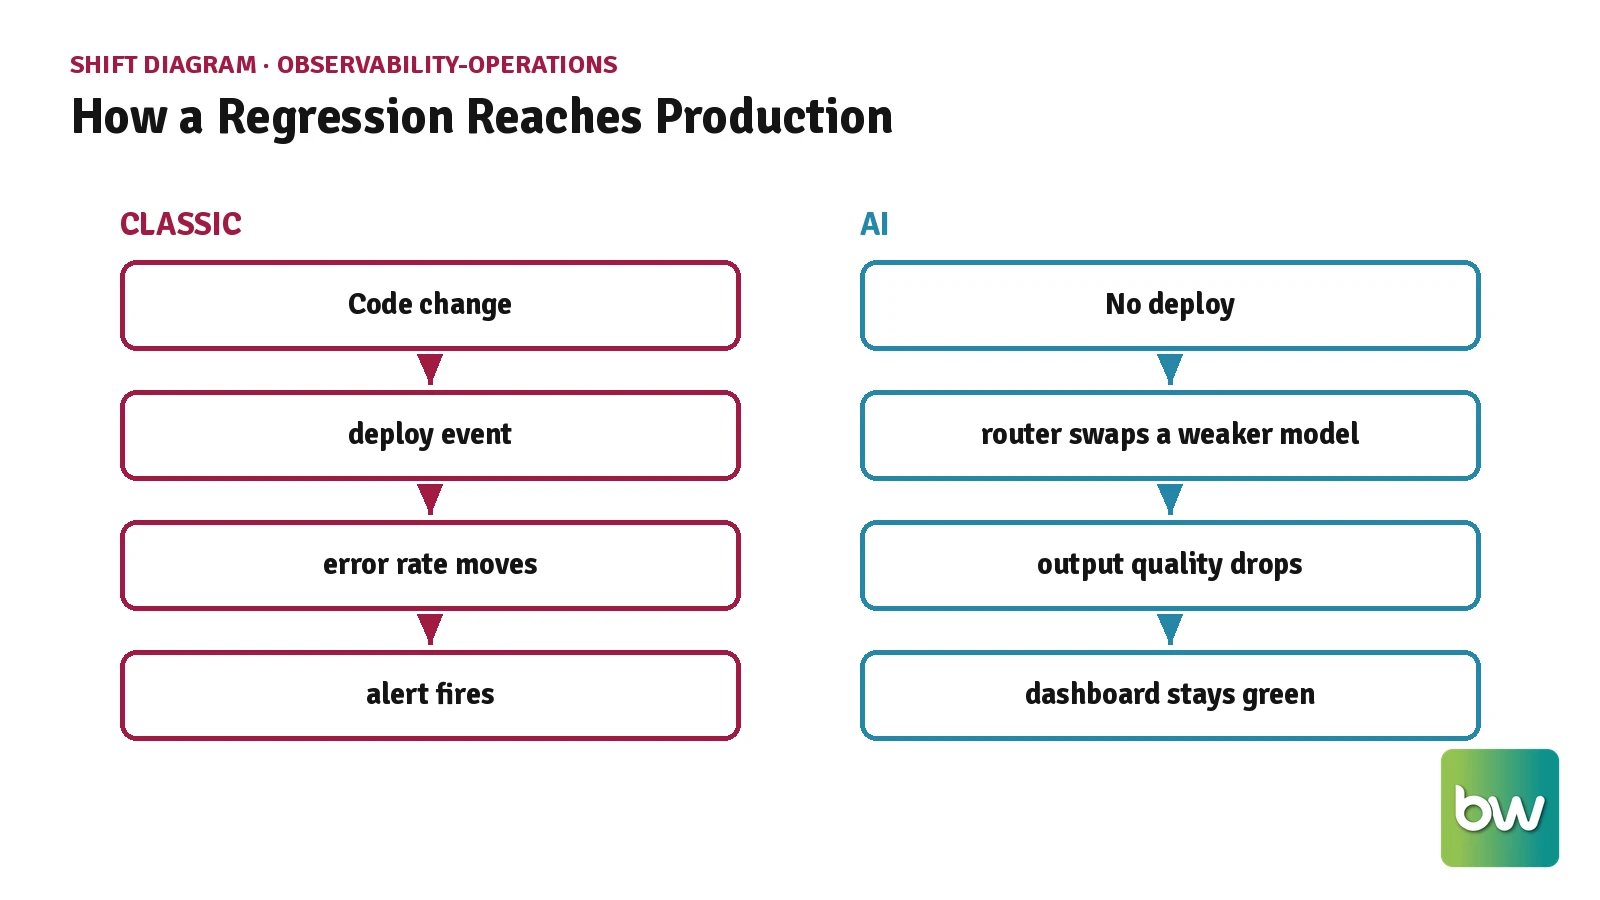
Shift Diagram: How a Regression Reaches Production Classic: Code change → deploy event → error rate moves → alert fires AI: No deploy → router swaps a weaker model → output quality drops → dashboard stays green
In practice, this means you instrument the served-model identity as a first-class field and alert when the mix shifts — because the routing layer will change your service without ever changing your code.
Eyeballing Samples Is Not Measurement
The most expensive habit developers carry into model work is deciding a prompt is “better” by reading a handful of outputs and nodding. It feels like testing. It is not.
The reason is variance. The same model, given the same prompt, produces different-quality answers across runs — and that within-model noise is not a rounding error. On creative tasks it accounts for anywhere from 10.56 to 33.70% of the total variation in quality scores. Which prompt you chose explains nearly as much of the outcome as which model you chose. So when you compare five outputs from prompt A against five from prompt B and A looks better, you have almost no idea whether you measured a real improvement or just caught the model on a good draw.
The fix is to stop trusting your eyes and start trusting a design. A/B Testing for LLMs borrows the machinery you already respect — stable assignment logged with the trace, a held-out set scored the same way every time, a real significance test instead of a vibe. The catch is scale. Reliable detection needs on the order of a hundred scored samples per variant, and the relationship is quadratic: halving the improvement you want to detect quadruples the samples you need. Sample Size and Statistical Power has the full math; the short version is that the small manual comparison you were about to trust is underpowered by an order of magnitude.
And the tool will not do this for you. Installing an observability platform does not mean quality regressions surface on their own; the platform records what happened, and judging whether it was correct needs an evaluation layer and a baseline sitting above it. That baseline has to exist before you instrument, or the dashboard has nothing to call abnormal. Prompt Regression Detection and Eval Pipelines is the layer most teams discover they are missing on the day they need it.
Before You Trust the Green Dashboard
You do not need to rebuild your stack this quarter. You need to know which questions your current dashboard cannot answer. Run these against your own service before you scale it.
| Runtime question | Why it matters |
|---|---|
| Do you log which model actually served each response? | A router or fallback can swap it with no deploy; if you don’t record it, you can’t tie a quality drop to the switch |
| Is there a scored sample of outputs, or only latency and cost? | Correctness lives in the content, and no infrastructure metric measures content |
| Does a baseline of “normal” quality exist from before you instrumented? | Without a prior, the monitoring system has nothing to call abnormal |
| When a latency alert fires, can you tell a hard query from degraded infra? | A fixed threshold conflates them and inflates your false-positive rate |
| Can you reproduce which prompt and model version produced a past answer? | Post-incident forensics needs the version lineage a Model Registry or prompt store provides |
| If a prompt change ships, is “better” defined by a test or by a glance? | Within-model variance makes eyeball comparisons statistically blind |
For the full prerequisite map and the questions this article deliberately skips, the LLMOps & Production topic hub is the register that answers them.
A green dashboard measures that your service answered, never that it answered well — health and correctness are separate axes, and only one of them is instrumented by default. Your next move is small and specific. Pick one live feature, start sampling its outputs for correctness, and log the model that served each one; the wiring is in How to Instrument a Production LLM App. Everything else builds on those two records.
AI-assisted content, human-reviewed. Images AI-generated. Editorial Standards · Our Editors