Inference Latency Is a Budget You Allocate, Not a Code Path
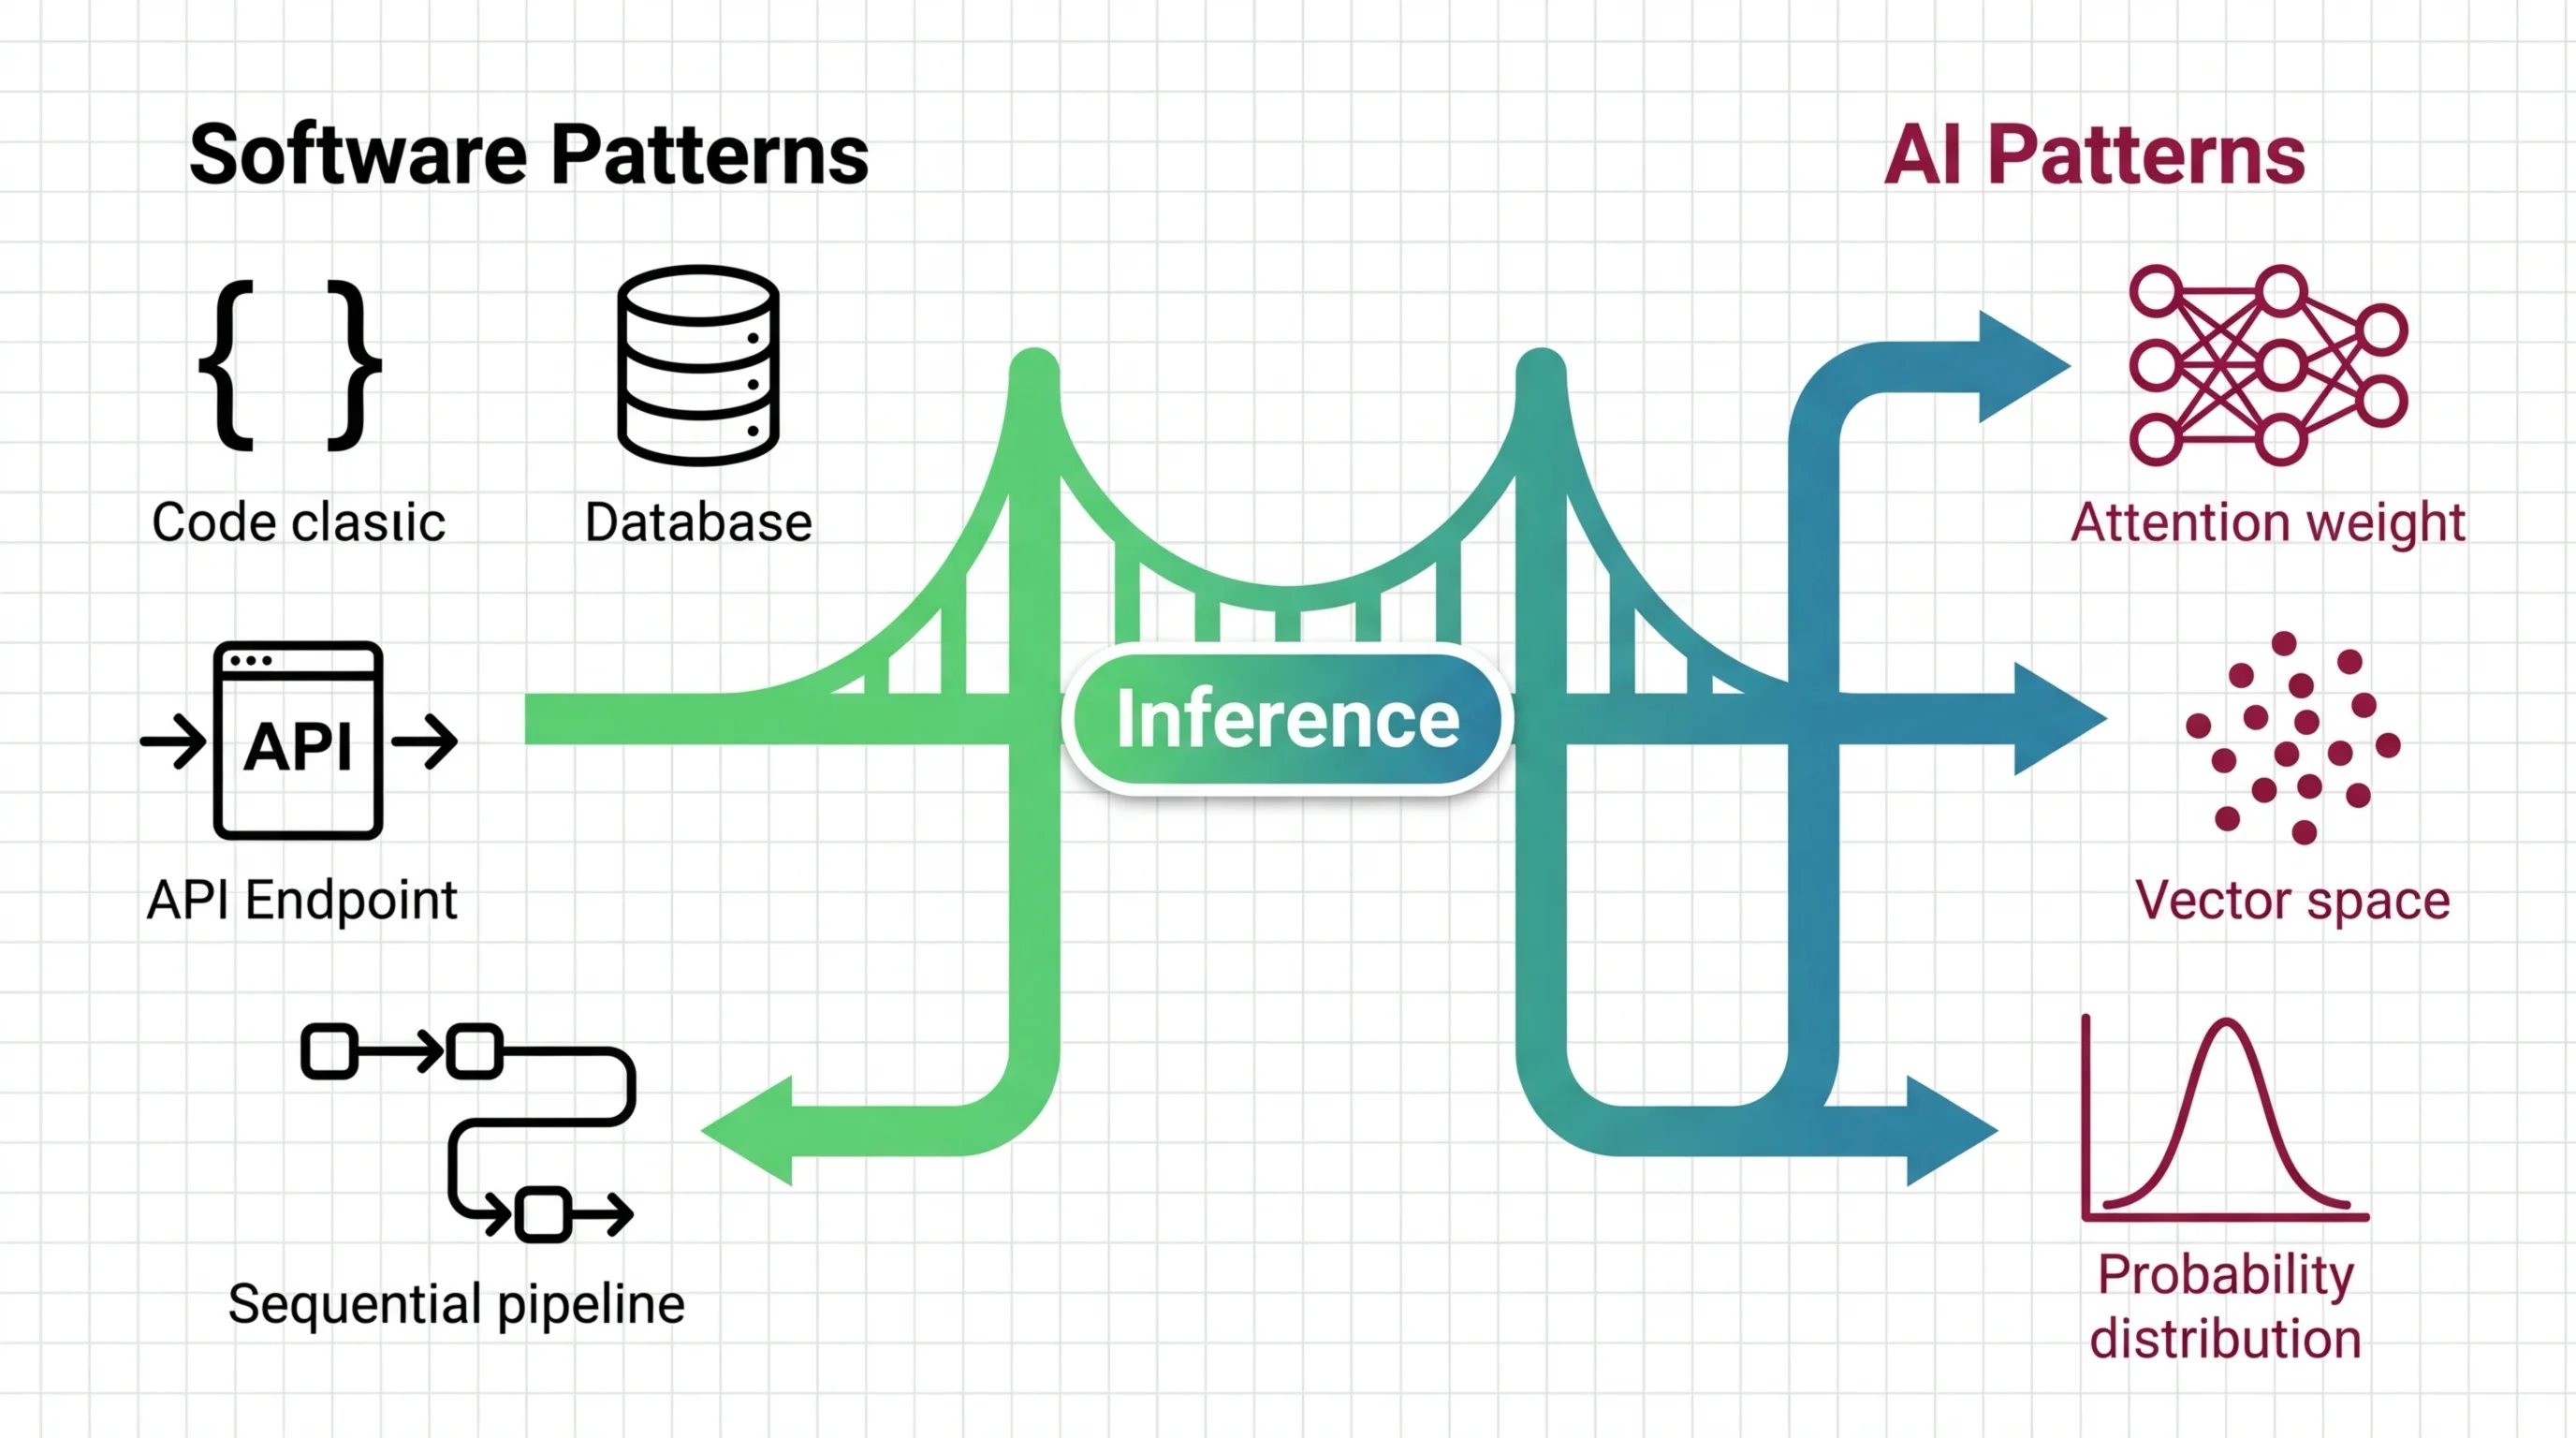
A vendor migration landed a model-inference service in your dependency graph. Nobody on the team went looking for it. Product shipped “summarize this thread,” the backend was yours, and month one the bill was a rounding error. Month three it was the second-largest line item in the infra budget — and daily active users had barely moved. So you pulled the request logs, expecting a traffic spike. Request count was flat. The number that grew wasn’t traffic. It was tokens — and your cost model never had a column for them.
Here is the reframe. Inference latency and cost are not a code path you profile and fix — they are a budget you allocate. You spend it across three levers: how many bits your weights carry, how you pack concurrent requests onto a GPU, and how long your sequences run. Every lever trades speed against memory, quality, or capacity. The assumption that breaks first is the one every REST-shaped instinct rests on — that cost scales with requests. It scales with tokens, and tokens scale with context. This is not a guide to training models. It is a guide to the runtime bill you inherit the moment you call one.
For the full prerequisite map and the deep mechanics behind each lever, see the topic hub. What follows is the part the hub can’t give you: where your existing engineering instincts still hold, and the exact points where they quietly stop predicting.
Your Cost Model Breaks at the Token
You budget for services by request volume. That arithmetic works for REST endpoints, database calls, and third-party APIs — anywhere the cost of a single request stays roughly constant regardless of what the payload carries. Inference does not work like that. The unit of cost is the token, input plus output, and a single endpoint can cost an order of magnitude more per request depending only on how much context you fed it.
Your capacity-planning instinct still transfers, up to a point. You still profile for peak concurrency. You still write a load test. You still watch p95. Keep all of that. What you have to add is a variable your REST load tests never carried: sequence length. A load test that fires a thousand short prompts will pass clean and then lie to you in production, because the real traffic arrives with long documents attached and each one drags a growing memory cost behind it. The cost scales with tokens times context, not with the request count your dashboard graphs.
Mental Model Map: Inference Cost From: Cost scales with request volume — more users, proportionally more spend Shift: The unit of cost is the token, and context length multiplies it nonlinearly To: Cost scales with tokens times context — the same endpoint bills 10x more per request as prompts grow Key insight: You are not paying per call. You are paying per token, and long context is where the budget silently drains.
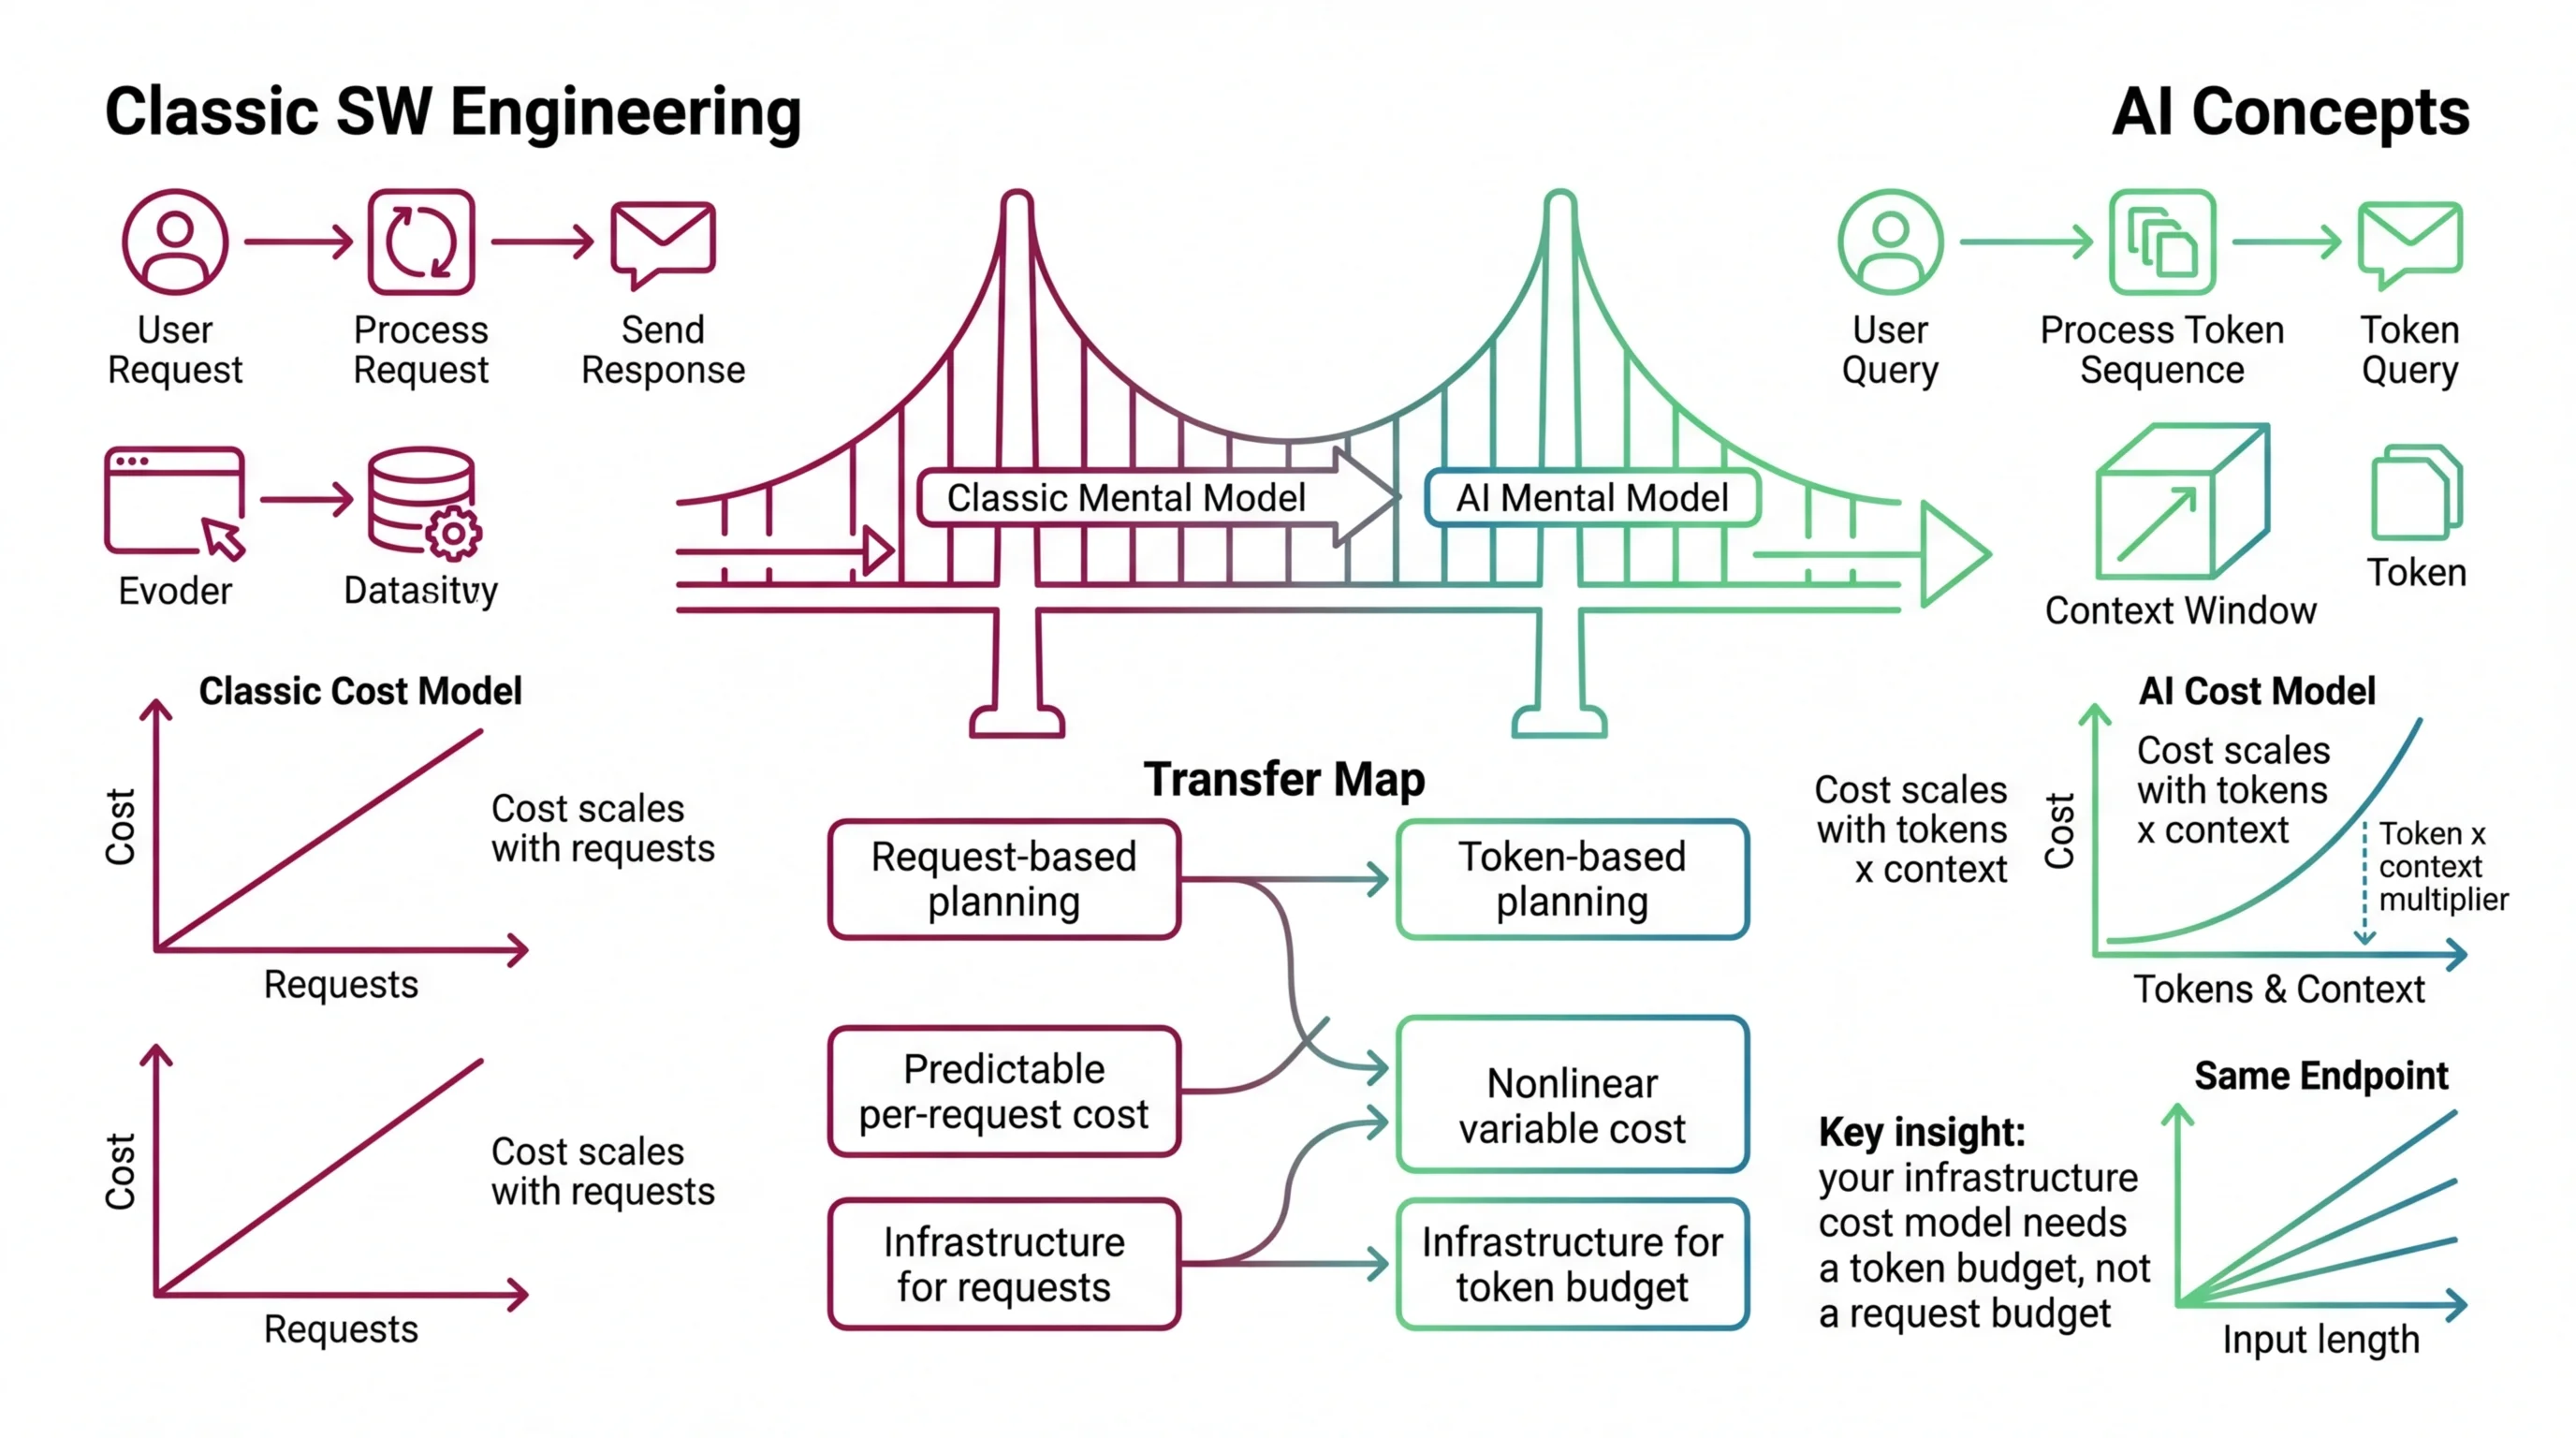
The scale of the shift is not subtle. GPT-3-class inference cost sixty dollars per million tokens in 2021; by 2024 the same workload ran at six cents — a thousand-fold collapse in three years (a16z). Prices fall, but your unit of accounting still changed underneath you. Budget by token volume with context-length multipliers, not by request count. The teams that get surprised by the invoice are the ones still holding the old unit.
| Classic REST endpoint | LLM inference | |
|---|---|---|
| Cost unit | Request | Token (input + output) |
| Cost scaling | Roughly linear with request count | Nonlinear — context length multiplies compute and memory |
| Capacity ceiling | CPU / connection pool | GPU memory (the KV cache) |
| Overload behavior | Latency degrades gradually | Hits a memory wall — requests get evicted or rejected |
The KV Cache Is Your Capacity Ceiling
When you self-host, the question “how many concurrent users does one GPU serve?” has a precise answer, and it is not set by CPU or by request rate. It is set by GPU memory. Every active request accumulates attention history — the KV cache — and that memory cannot be freed until the request finishes. The number of sequences a GPU can hold at once is bounded by how much KV cache fits alongside the model weights.
The scheduling side maps onto familiar ground. Request slots behave like a connection pool: requests share the GPU, finished ones release immediately, waiting ones fill the gap. That instinct is good. What does not transfer is the cost of holding a slot. A database connection is uniform and cheap. A batch slot carries a memory cost that grows with every token generated and cannot be handed back mid-request. A single sequence on a 13-billion-parameter model can consume up to 1.7 GB of GPU memory just for its cache (vLLM Blog). Push a 70-billion-parameter model to 32,000 tokens of context and the cache alone demands roughly 80 GB — the entire memory of an H100, spent on one conversation’s history.
This is why memory, not compute, is the failure mode you plan around. During decode, the GPU spends most of its time fetching weights and cached history from memory — the tensor cores sit idle waiting on data, so a faster chip that reads memory at the same speed produces tokens at nearly the same rate. The mechanism behind that ceiling, and the operating-system trick that raised it, is MONA’s breakdown of KV-cache and PagedAttention; the quadratic memory math that makes long context so expensive is in her analysis of memory walls and context costs. In practice, this means the ceiling on concurrent users moves every time you change the context window — and you cannot size the box without knowing your real sequence lengths.
Continuous Batching Buys Throughput, Not Speed
If you read one thing about serving optimization, it is that Continuous Batching transformed inference economics. The dangerous takeaway is that it makes each request faster. It does not. It keeps the GPU busy on every forward pass by swapping finished requests out and new ones in at the level of individual decode steps, instead of holding the whole batch hostage to its slowest sequence. The win is measured per GPU, not per request. Static batching leaves GPU utilization sitting at 30 to 60 percent; iteration-level scheduling can push it to 80 to 95 percent under favorable conditions.
Provision for the wrong win and you buy the wrong hardware. A team expecting a per-request latency drop sizes a small fleet and promises a tight time-to-first-token SLA. What they actually bought was throughput headroom — more concurrent users per GPU dollar — while tail latency under load can get worse, not better. In vLLM’s own measurements, p99 per-token decode latency runs about 3.8x worse than the p50 median, and preemption accounts for roughly 70 percent of the requests hitting that p99 degradation (vLLM Blog). The same aggressive eviction cycle that fills the GPU is what spikes the tail.
Shift Diagram: Request Scheduling Classic: Group requests into a fixed batch → run to completion → release the whole batch → admit the next AI: Admit requests continuously → swap finished ones out every decode step → refill freed slots instantly → GPU never waits for stragglers
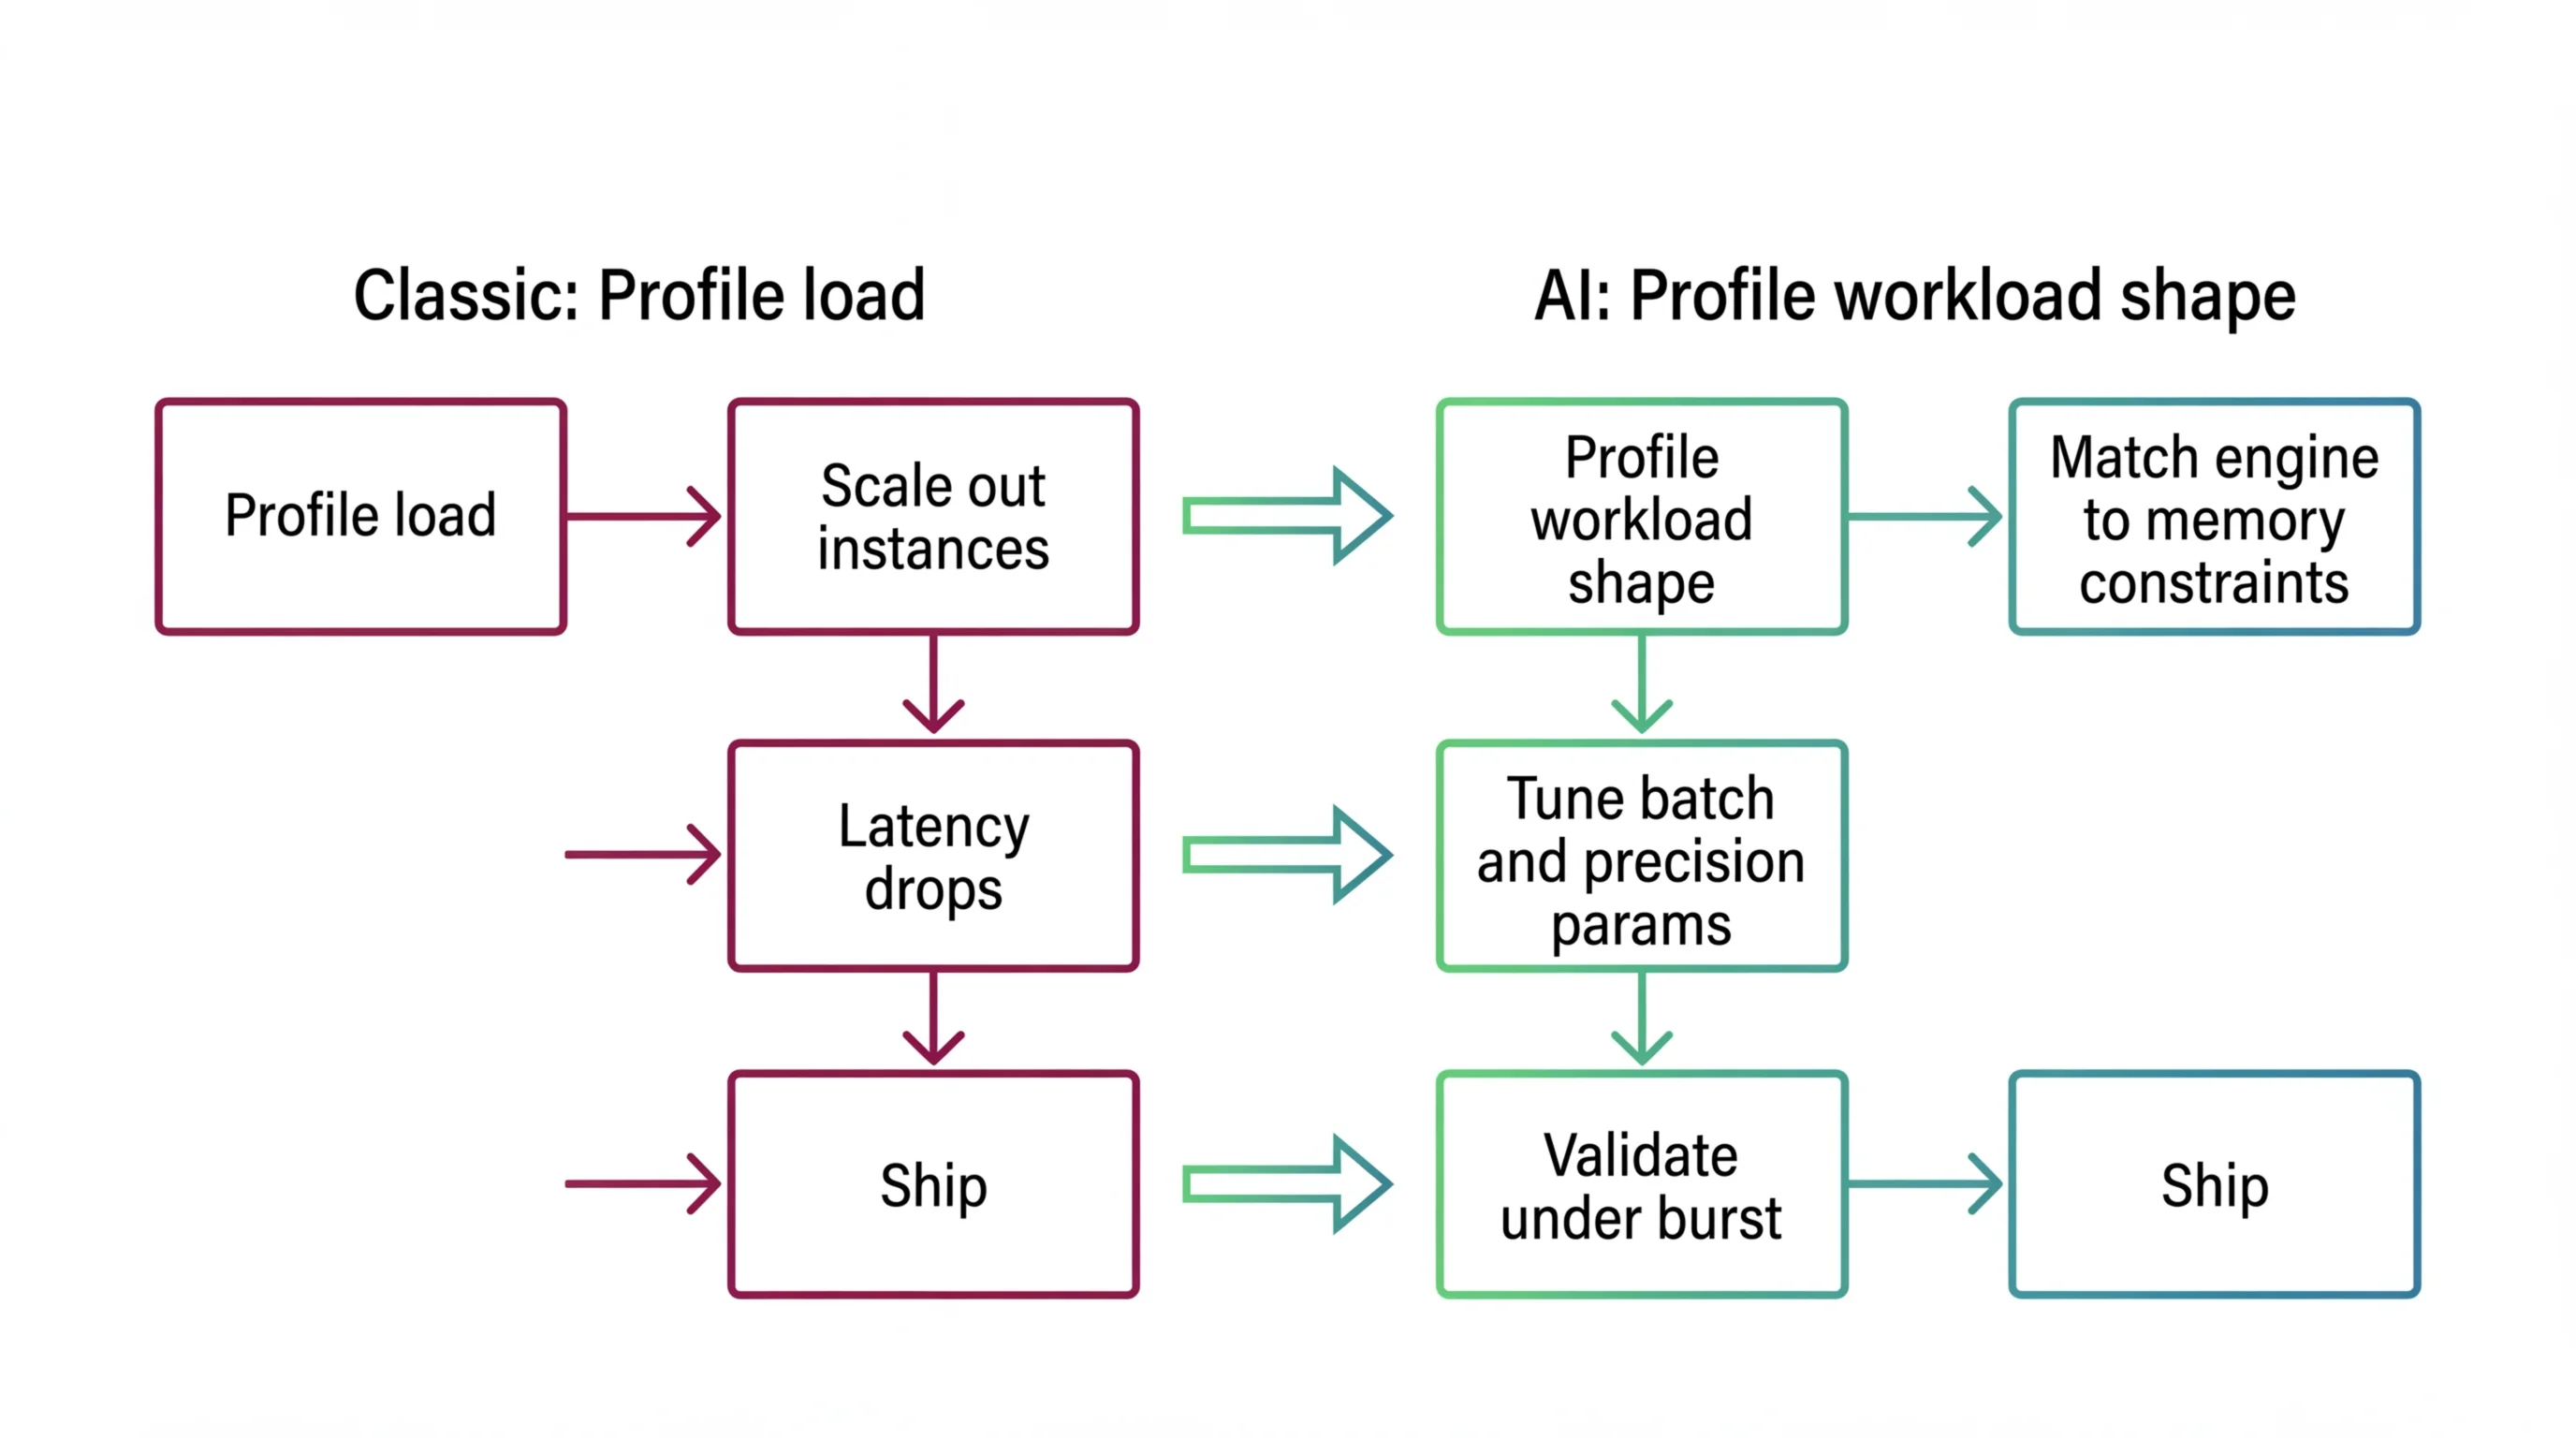
The connection-pool instinct carries you into the concept and then stops. Your throughput reflex assumes each unit of work is roughly uniform and independent. Here the units vary from twenty tokens to two thousand, and packing more of them onto one GPU trades median throughput against tail latency — a trade your pooling model never had to make. The payoff, when the shape fits, is real: switching to continuous batching cut Stripe’s inference costs by 73 percent, letting it serve 50 million daily API calls on one-third of its previous GPU fleet, according to an internal case study reported by DAN’s roundup of continuous-batching deployments — one data point, not a guarantee. Where the mechanism helps most and where it breaks down is MONA’s walk from static batching to PagedAttention, and the parameter-level tuning is in MAX’s deployment guide. In practice, this means continuous batching is your default substrate, not your latency fix — and if your outputs are uniformly short, most of the promised gain never arrives.
Quantization Cuts Cost Until It Cuts Quality
“Just quantize it” gets said in planning meetings as if it were free capacity. It is a real lever — one of the strongest you have — but it has a floor, and the floor is not where the arithmetic suggests. Quantization compresses model weights from 16-bit down to 4-bit or lower, cutting memory by around 75 percent so a model that needed 140 GB of GPU memory runs on hardware you can actually rent. At 4-bit precision, models hold roughly 95 percent of their baseline quality on common tasks like chat and summarization. That is the deal that makes self-hosting viable.
The JPEG analogy helps here — dial the quality down, save space, accept a little softness. It helps right up to the point where it stops. JPEG degrades uniformly: every pixel gets the same treatment. Quantization does not. The damage concentrates in the rare, high-impact weights that hold reasoning and less-common languages together, so quality loss is uneven — near-invisible on easy tasks, sharp on hard ones. And below four bits it is not a gentle slope. Drop under 4-bit on a model smaller than eight billion parameters and accuracy can fall by more than ten percent — a cliff, not a dimmer. The full pattern of where and why capability collapses is MONA’s study of sub-4-bit accuracy limits. In practice, this means 4-bit is a safe production default for straightforward workloads, sub-4-bit is a decision you validate on your tasks before you ship, and the memory you “save” past the floor is bought with quality your benchmarks on easy prompts won’t catch.
One more lever feeds the same token budget from the output side. Your Temperature And Sampling configuration shapes how much text the model generates, and output tokens cost the same as input tokens — verbose defaults quietly inflate the bill on every call.
Before You Size This Endpoint
The reframe only pays off if it changes what you check before you provision. These are questions about your own stack, not googleable trivia — the kind that decide whether the endpoint survives its first real traffic.
| Runtime question | Why it matters |
|---|---|
| What is the real distribution of my sequence lengths, not the average? | Cost and memory scale with context; a few long requests can blow the budget the average hides. |
| What context window did I promise, and what does it cost in KV cache at peak concurrency? | The window sets your per-request memory floor and moves the concurrent-user ceiling. |
| Is my load test firing production-shaped payloads, or short synthetic prompts? | A short-prompt test passes clean and hides the memory wall you hit on real traffic. |
| Am I provisioning for throughput or for per-request latency? | Continuous batching buys the first, not the second; confusing them mis-sizes the fleet. |
| What is my p99-to-p50 latency ratio under burst? | A ratio climbing past roughly 3x means preemption is dominating your tail. |
| What is my quality floor per task, and did I test quantization against it? | 4-bit is safe for easy tasks; sub-4-bit needs validation on your hardest workload. |
Validate every number against your own environment and your own provider’s limits before you commit hardware or a pricing model — the figures above come from other teams’ stacks, not yours.
Stop thinking of inference speed as a bug to fix and start thinking of it as a budget to allocate: bits, batching, and sequence length are the accounts you spend from, and every withdrawal trades against memory, quality, or capacity. Before your next capacity review, pull your real sequence-length distribution and your p99-to-p50 ratio — those two numbers tell you which lever you are actually short on.
AI-assisted content, human-reviewed. Images AI-generated. Editorial Standards · Our Editors