Before You Monitor LLMs: MLOps Prerequisites and the Technical Limits No Observability Tool Can Fix
ELI5
LLM observability instruments your model’s inputs, outputs, latency, and cost at runtime — but assumes you already have structured logs, baseline metrics, and a model versioning strategy. Without those foundations, traces are detailed noise.
There’s a diagnostic failure pattern that recurs in LLM deployments: the observability dashboard is running, traces are flowing, latency distributions are rendered in real time — and nobody can answer whether the model is performing well. The data exists, timestamped to the microsecond. But without a prior distribution of “expected” to compare against, the dashboard is measuring deviation from nothing in particular. This is not a tooling gap. It is a sequencing error.
The Stack That Has to Exist Before Tracing Starts
LLM Observability tools are span collectors. They record what happened — model version, token counts, latency, prompt content if enabled — and expose that data for querying and visualization. What they cannot record is whether the output was correct, because correctness is a reference-dependent judgment and the reference must be established independently, before instrumentation begins.
Three components need to exist in a system before an observability tool adds meaningful signal.
What do you need to know before setting up LLM observability?
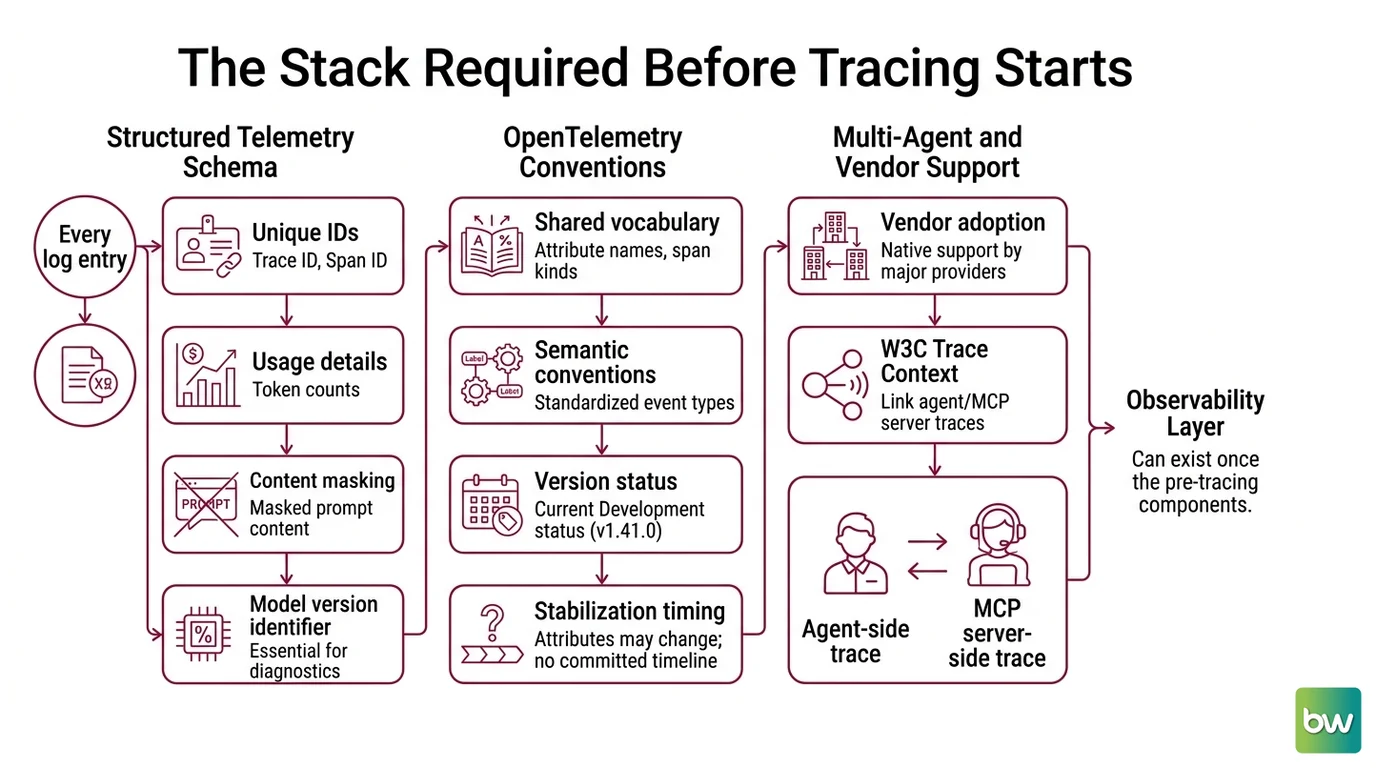
Structured telemetry schema with identifiers. Every log entry must carry a trace_id, span_id, token usage, masked prompt content, model version identifier, and high-precision timestamps (OpenObserve Blog). The model version identifier is not optional for diagnostic purposes — when behavior changes, the first question is always whether the model version changed, and a log that doesn’t record it cannot answer. This seems obvious; in practice, version identifiers are frequently omitted from early instrumentation because the initial model choice seems fixed, and then it isn’t.
The OpenTelemetry GenAI semantic conventions provide the shared vocabulary for this schema: attribute names, span kinds, event types. As of mid-2026, these conventions are at version 1.41.0 and carry Development status — not stable (OpenTelemetry Blog). That distinction matters for production systems: attribute names may still change before stabilization, and no public timeline has been committed for when that happens (Greptime Blog). Datadog, Google Cloud, AWS, and Azure have adopted native support for v1.37 and above, which provides reasonable vendor coverage for the current attribute set. For multi-agent architectures, MCP server-side traces can be linked to agent-side traces via W3C Trace Context, a capability introduced in v1.39 (Greptime Blog) — relevant wherever a single user-visible action spans multiple tool calls.
One content-capture decision needs to be made before enabling tracing: prompt and completion logging is disabled by default in the OTel GenAI conventions because prompt content typically contains user data (OpenTelemetry Blog). Enabling it without a masking or redaction layer first creates a data handling liability that compounds with retention policies. The operational question is not which tool supports content capture — most do — but what the policy is for the captured text.
Baseline metrics established before production. MLOps practice requires that accuracy, latency, token cost, and safety violation rates be measured in a pre-production environment before the production rollout. The reason is statistical. An observability alert fires when a metric deviates from its expected range. Without a prior distribution to anchor that range, the monitoring system has no basis for distinguishing “anomalous” from “normal” — and because LLM outputs are stochastic, the baseline distribution itself has variance that needs to be characterized before any threshold is meaningful.
A baseline is a threshold with history.
What constitutes accuracy for an LLM is domain-dependent. A customer support model has different correctness criteria than a code generation model. This definition cannot be imported from a default configuration; it must be established by the team that understands the task, before instrumentation begins. No tool can make this determination on your behalf.
Log structure that enables correlation. Distributed Tracing in LLM systems requires that spans across the request pipeline — retrieval, embedding, generation, evaluation — carry consistent identifiers that allow reconstruction of the full request journey. This prerequisite is more complex in agent architectures than in single-model calls, because the same observable system behavior (a slow response) may originate in the retrieval layer, the generation layer, or the communication between them. Without correlated span identifiers, post-hoc diagnosis is inference rather than tracing.
The Failure Modes That Live Below the Dashboard
The three prerequisites above are tractable engineering problems. Install them, and the observability tool gains meaningful input. What follows is a different category: structural gaps between what monitoring infrastructure can observe and what actually determines whether an LLM system is behaving correctly.
These gaps don’t close with better tooling. They are properties of the system being monitored.
What are the technical limitations of LLM observability tools in production?
Hallucination detection operates after the fact. A model can produce fluent, syntactically correct output that is factually wrong — and no monitoring layer positioned between the model and the user prevents this (arxiv 2604.26152). The observability span records the token count, the latency, the model version, the timestamp. It does not record whether the claim in the output is true. Catching that requires an evaluation step — a judge model, a retrieval comparison, a human review gate — that runs after the output is generated, not before the user receives it.
Observability surfaces symptoms, not causes.
The practical consequence: hallucination management is an evaluation architecture problem, not an observability infrastructure problem. Observability tells you that a response was generated; evaluation tells you whether that response was worth generating.
The cross-layer correlation gap. Current monitoring stacks cannot connect model confidence signals with infrastructure anomalies (arxiv 2604.26152). A latency spike has two structurally distinct causes: the model is processing a difficult query with an unusually long reasoning chain, or the infrastructure is degraded — GPU memory fragmentation causing KV cache eviction and recomputation (arxiv 2604.26152). Both appear in the observability layer as a slow span. The diagnostic distinction requires correlating the model’s internal state with the infrastructure metrics, and no current tool provides this as a first-class capability.
The consequence is that latency alerts have a systematically higher false-positive rate in LLM systems than in deterministic services. A slow API call in a microservice implies a resource or logic problem. A slow generation might imply a harder problem — or simply a harder question.
Non-determinism makes statistical baselines expensive to maintain. The same input can produce different reasoning paths across invocations (arxiv 2604.26152). Determining whether a change in output quality is a genuine regression or a stochastic fluctuation requires semantic traces per decision point, not just latency and token counts. Existing monitoring frameworks are largely static in their alert sensitivity — they apply fixed thresholds rather than adjusting dynamically based on the current distribution of query complexity (arxiv 2604.26152). A system handling simple queries and a system handling complex queries produce very different latency distributions; a threshold calibrated on one will misfire on the other.
The Observability Assumptions That Don’t Transfer
Variance is a feature, not an anomaly — and monitoring infrastructure was not designed for systems where that sentence is true.
Traditional monitoring was built for deterministic services: a request goes in, a response comes out, and any deviation from the expected response pattern is definitionally a defect. Alerting on deviations made sense because the response space was bounded and consistent. LLM systems don’t operate this way. The variance between two responses to the same prompt is not a bug; it is an expression of the sampling distribution. Some of that variance is desirable. Some of it is a regression. The monitoring system cannot tell which is which without a semantic evaluation layer that sits above the infrastructure.
This has a practical implication for how observability tools should be used. They work reliably as data collection and visualization infrastructure — as systems that record what happened and make that data queryable. They work poorly as autonomous alerting systems for output quality, because quality is a judgment that requires semantic context the infrastructure layer doesn’t carry. The delegation of that judgment to threshold-based alerting is a category error.
This doesn’t mean alerting is useless in LLM systems. Latency, token cost, error rates, and safety violation counts can all be monitored with conventional approaches. But the signal-to-noise ratio for quality-adjacent alerts remains low until the team has built an evaluation architecture that complements the observability layer rather than replacing it.
What the Prerequisites Predict About Your Tool Choice
The prerequisite stack doesn’t just determine whether an observability tool will produce useful data — it determines which tools are worth evaluating at all. If structured telemetry is absent, trace visualization produces beautiful views of unqueryable data. If the baseline metrics aren’t defined, alerting configurations are thresholds against nothing.
The prerequisite stack determines diagnostic accuracy — not the tool selection that follows from it.
A few observations on the tooling situation, as of mid-2026:
LangSmith provides native tracing for LangChain and LangGraph stacks, with rich graph visualization of agent reasoning traces. The free tier allows 5,000 traces per month with 14-day retention and one seat; the Plus plan runs $39 per seat per month for 10,000 traces with email support (LangChain’s pricing page). The tracing model is deeply LangChain-native; teams not using that ecosystem will find the graph visualization less compelling relative to alternatives.
Arize Phoenix is OTel-native and open source, with an extensive suite of evaluation metrics. Version 14.0.0, released April 2026, introduced breaking changes that require migration from existing integrations — see the compatibility note below. Langfuse offers broad multi-framework support without major version deprecations at the time of writing.
If LiteLLM functions as a proxy layer in your stack: two CISA KEV vulnerabilities were actively exploited in early 2026, alongside a supply chain compromise in specific PyPI releases. Review the consolidated security note and verify your installed version before continuing.
If your LLM deployment meets the EU AI Act’s definition of a high-risk AI system, logging and audit trail requirements apply from August 2026 (Gravitee Blog). The high-risk classification is not automatic; it follows from specific use-case and risk criteria defined in the Act, and classification varies by deployment context.
Security & compatibility notes:
- LiteLLM (CVE-2026-42208 + CVE-2026-42271): SQL injection (CVSS 9.3) affects v1.81.16–v1.83.6; unauthenticated RCE (CVE-2026-42271); both on CISA KEV and actively exploited. Supply chain backdoor found in v1.82.7/v1.82.8 on PyPI (The Hacker News). Fix: pin to v1.83.7+ (LiteLLM Docs, Security Arsenal). Verify installed version before continuing.
- Arize Phoenix v14.0.0 (April 7, 2026):
px.Client()removed — migrate toarize-phoenix-client. REST/v1/evaluationsendpoints removed. Evals 1.0 legacy subpackage removed (Arize Phoenix Docs).- Helicone: Acquired by Mintlify (~March 2026); maintenance mode, no new features planned. Avoid for new projects (Helicone Blog).
Rule of thumb: Instrument the model version identifier and baseline latency percentiles first. These two signals catch the most common production regressions at the lowest instrumentation cost.
When it breaks: The baseline assumption collapses under significant query distribution shift — when the traffic pattern in production diverges from the pre-production distribution on which baselines were established, all deviation thresholds become miscalibrated. Re-establishing baselines after a meaningful shift in usage patterns is ongoing calibration work, not a one-time setup step.
The Data Says
LLM observability tools can collect what happens; they cannot verify whether what happened was correct. That determination requires baselines established before instrumentation, an evaluation architecture built above the observability layer, and tolerance for the structural ambiguity that comes from monitoring stochastic systems with deterministic alerting frameworks. The tools are necessary. They are not sufficient.
AI-assisted content, human-reviewed. Images AI-generated. Editorial Standards · Our Editors